
Chartbook #5
April 18, 2021

Hello everyone and welcome back to the 5th Chartbook! This will be a special Rates Volatility Edition focusing mostly on a single theme throughout. While next week’s post will likely return to a mix of topics, there may be occasional special editions like this in the future. Okay, let’s get started!
US Treasuries
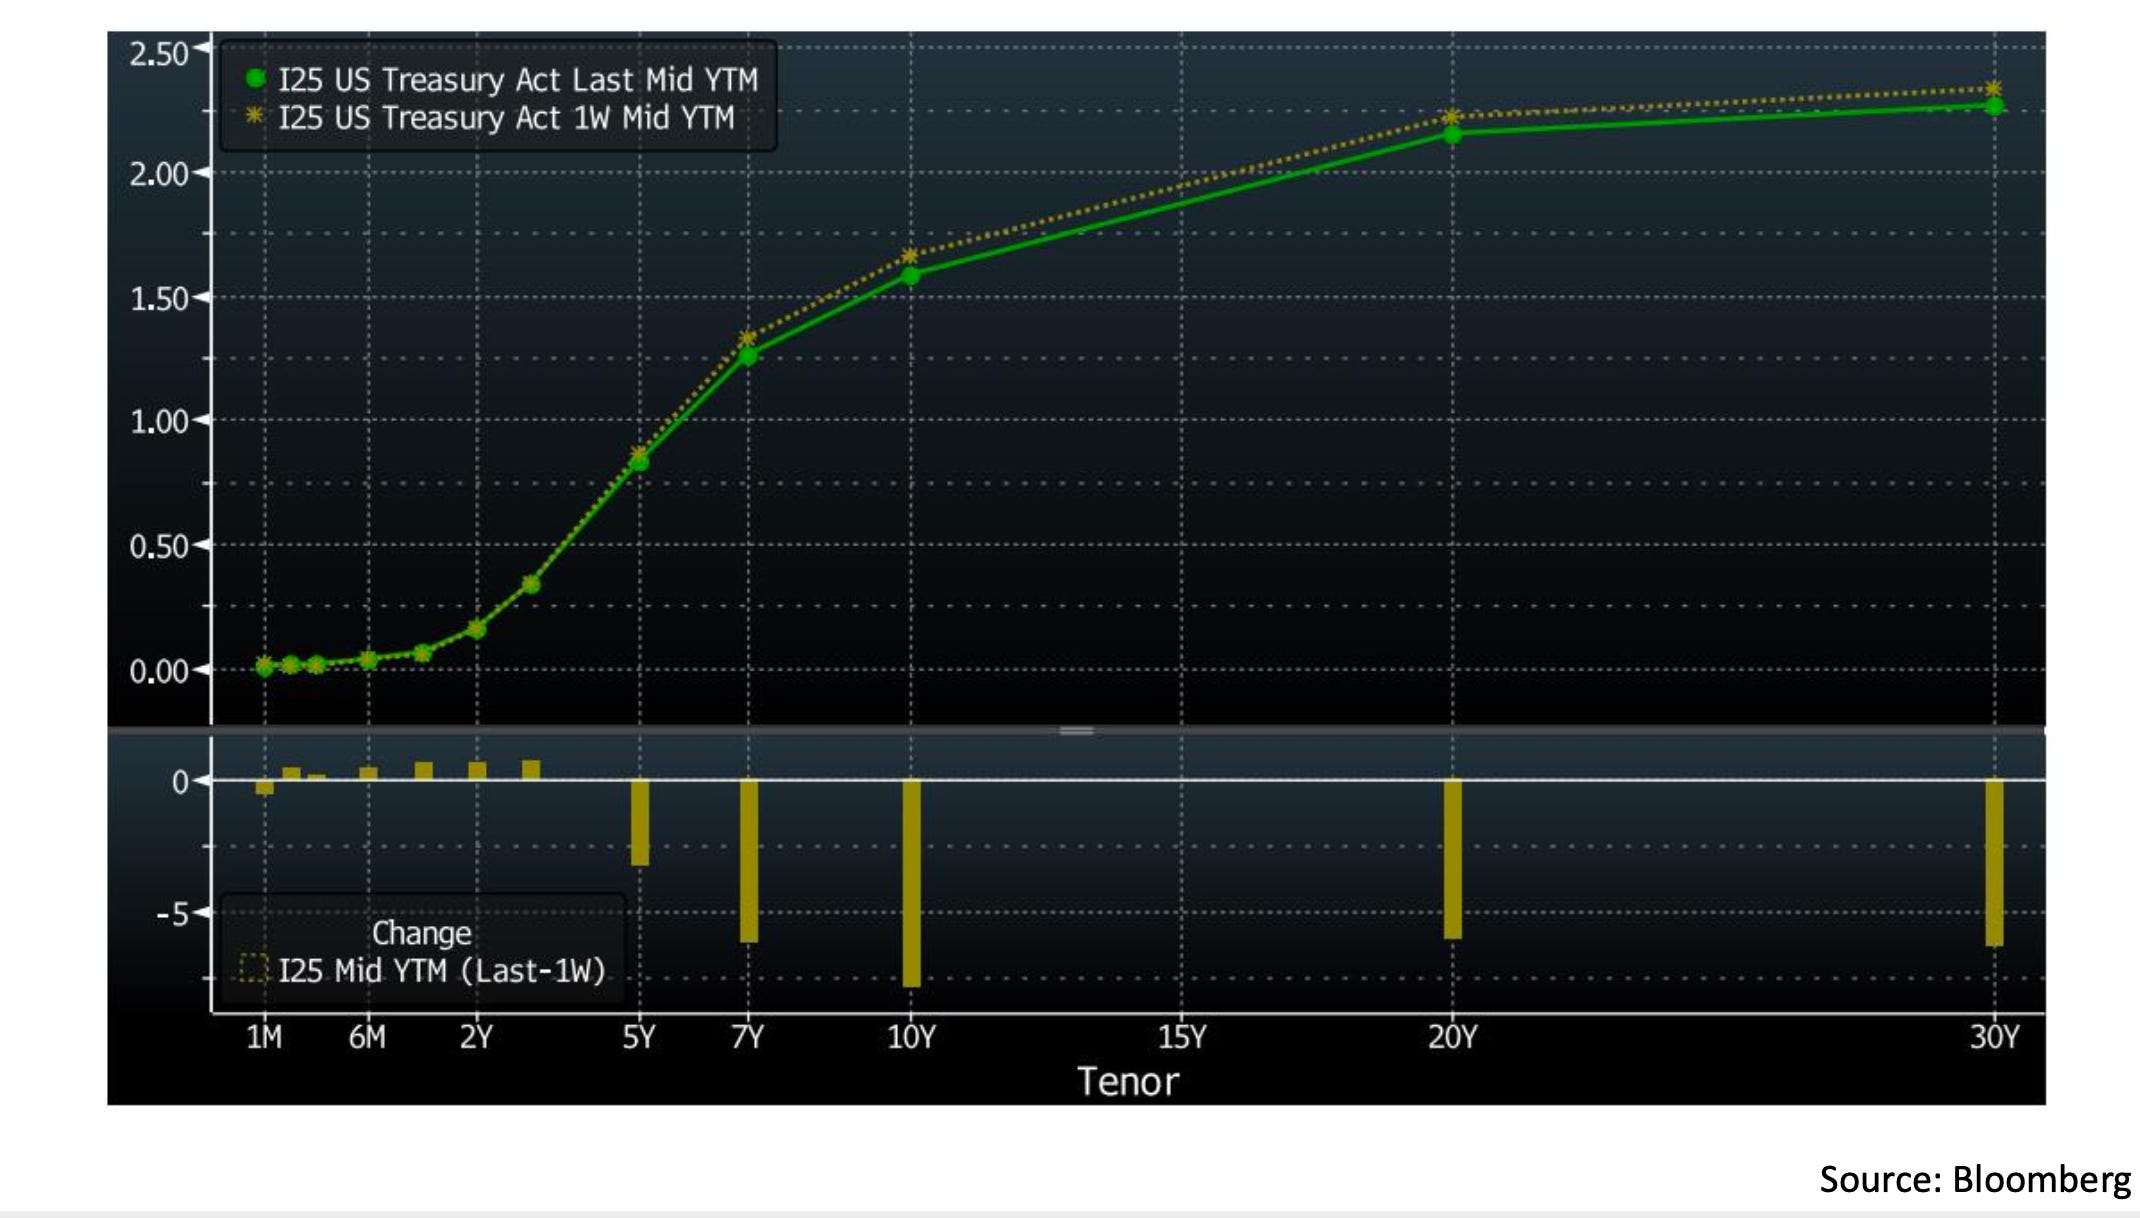
To begin, let’s look at the US Treasury yield curve as usual. The top panel of the chart shows the curve at the close of April 9 (dashed line) and the latest curve as of the close on Friday (solid line). The bottom panel shows the changes from last week in basis points. While yields out to the 3 year maturity were little changed, the 5 year through 30 year maturities came down significantly in yield (up in price) led by the 10 year. This contrasts slightly with the trend discussed in the previous Chartbook, where last week’s rally in Treasuries was led by the 5 year.
A possible reason for this is that a new driver is may be ramping up its presence in the market since the start of April. The weekly data release from Japan’s Ministry of Finance on Thursday showed a ¥1.7 trillion (roughly $16 billion) net purchase of foreign long-term debt securities during the week of April 4-10 (see table 1, bottom row). Much of this buying was likely in US Treasuries and may have continued into this past week (we will find out in this coming Thursday’s data release). This would be logical as long term US Treasuries provide an attractive yield relative to other developed market sovereign bonds, even including the cost of hedging currency exchange rate risk for most major currencies. One factor that would hold foreign investors back though is interest rate volatility. If rates are perceived as likely to change rapidly, foreign buyers may pause until some relative calm returns to the bond market. The next few sections will discuss how interest rate volatility has evolved since December 2020 and where market expectations stand currently!
Volatility Cube
Before getting started, a brief intro on various gauges of interest rate volatility. While equity market volatility has a widely accepted index (the VIX based on S&P 500 index options) and a large volatility futures and derivatives market, there is no direct analogy in the bond market. Rates-linked options are traded across a variety of products of all different maturities, so creating a single index to reflect market-implied expectations of volatility in rates is almost impossible to do without significantly diluting useful signals.
A way around this is to look at the entirety of the interest rate volatility cube in a certain product (here USD interest rate swaps). The three dimensions of the volatility cube are option expiry, option strike, and the duration of the underlying contract. This cube can then be filled in with the implied volatilities of the relevant options based on market prices and slightly-modified conventional options pricing models like Black-Scholes. However, since visualizing and displaying values within a cube is difficult for inhabitants of a 3D space like us, most people look at many slices of the volatility cube across different axes to get the full picture of what is going on. We are almost ready to start looking at some data, but first a quick word on the contracts that will be used here.
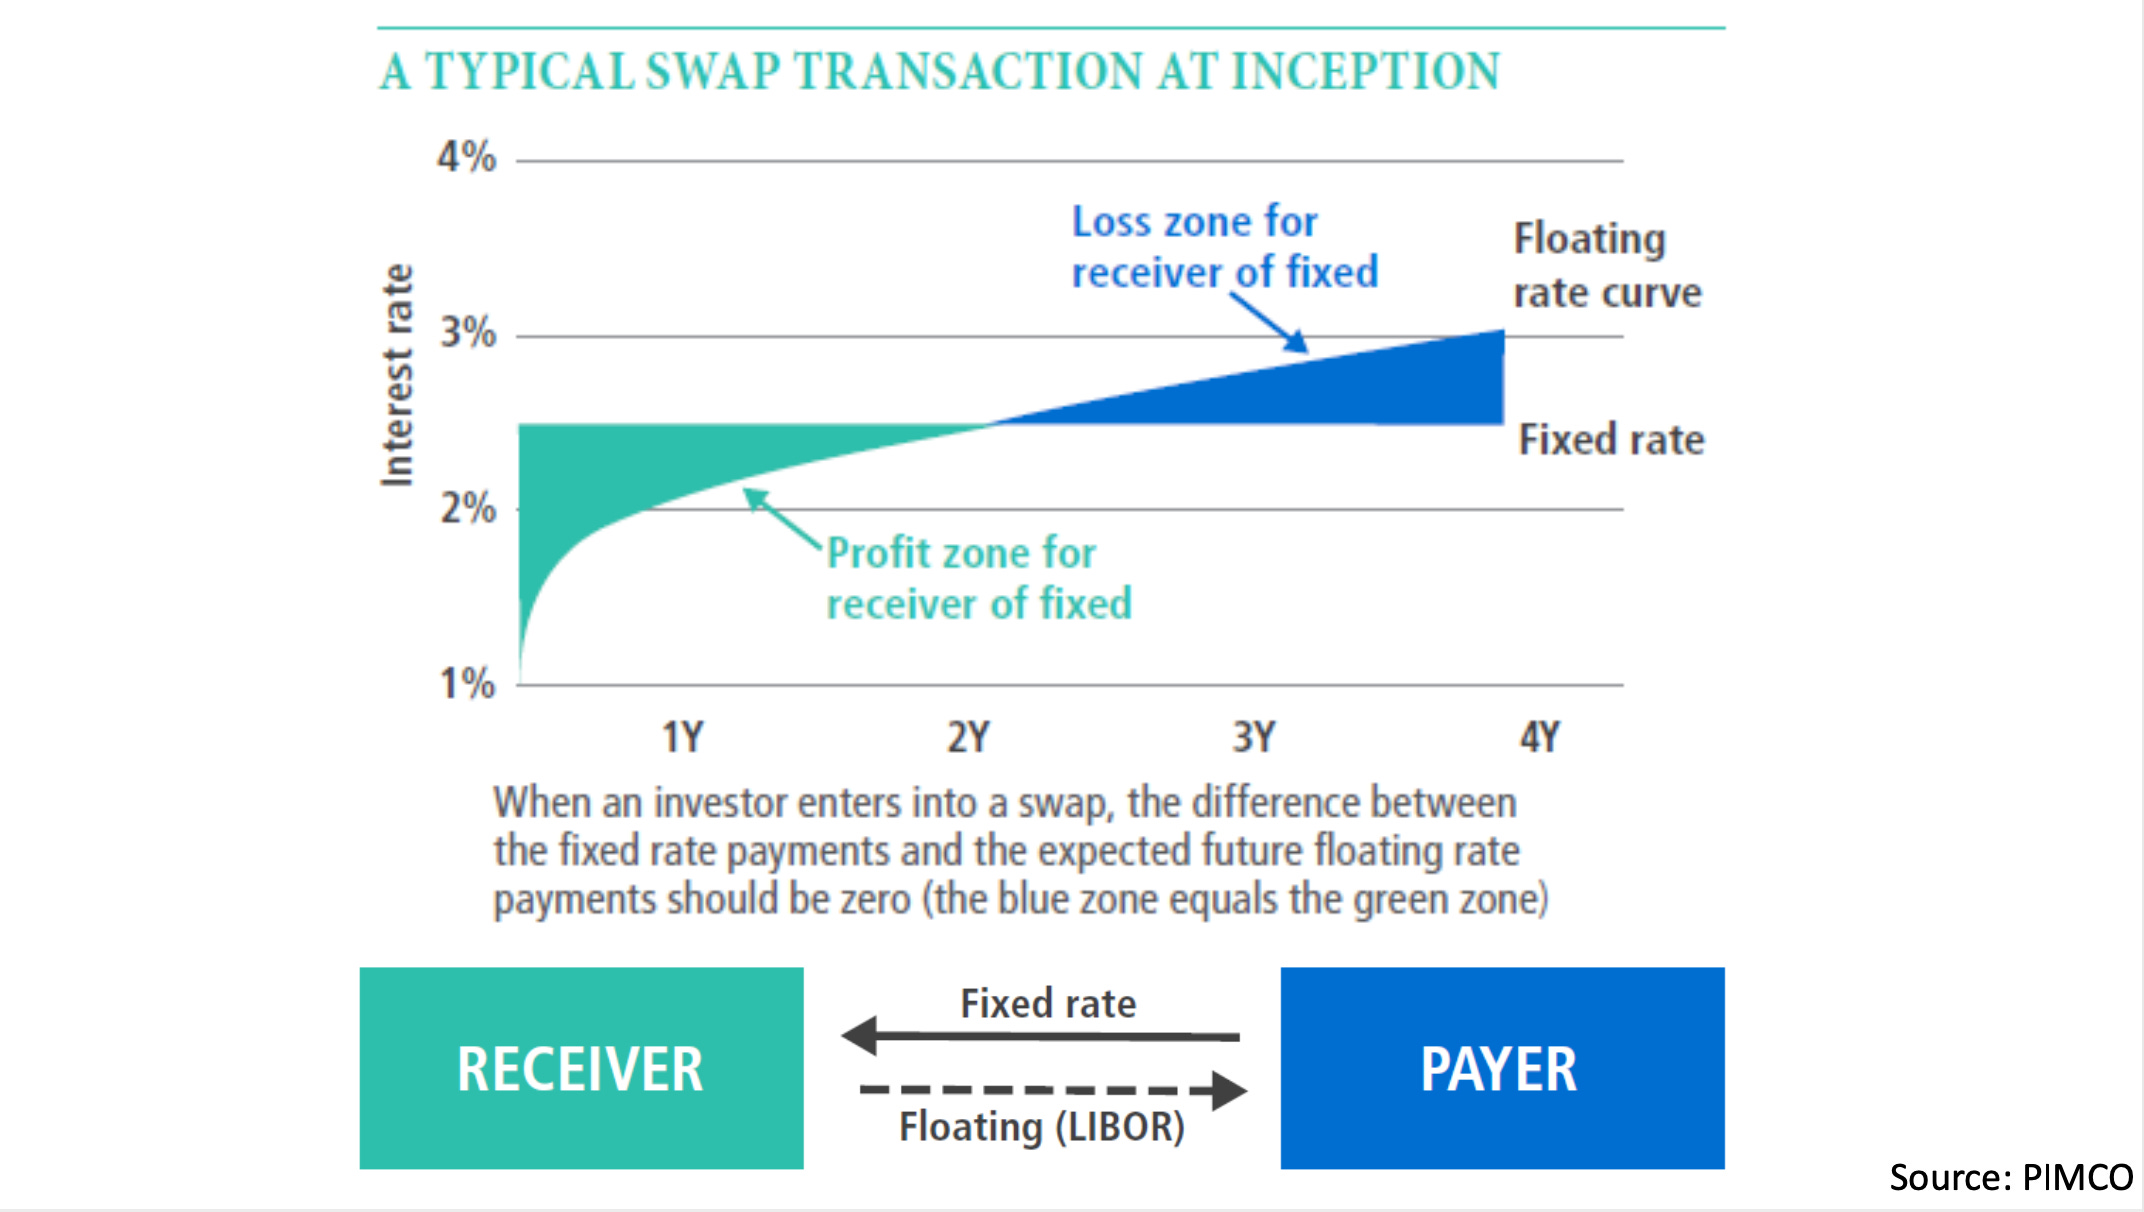
The diagram above shows the typical cash flow of a fixed-floating interest rate swap, which will serve as the option underlying here. One counterparty pays a fixed rate on the notional amount and the other counterparty pays a floating rate on the same amount based on some agreed short term rate index (Libor in the diagram). In theory, swap pricing is fair when the fixed rate accurately reflects market expectations for the short term rate compounded over the swap lifetime, as shown in the chart.
Finally, options on such swaps (called swaptions) give the holder the option, but not the obligation, to enter into the underlying swap at time of expiry. Swaptions allowing the holder to enter from the ‘Payer’ side are called ‘Pay Fixed Swaptions’ and ones allowing entry from the ‘Receiver’ side are called ‘Receive Fixed Swaptions’. In addition, it is possible to trade ‘Swaption Straddles’ that allow the holder to enter either side of the swap. Straddles are convenient for calculations of implied volatility since they do not imply a preference for side and will be used here throughout the charts. Okay, now let’s actually look at some slices of the volatility cube!
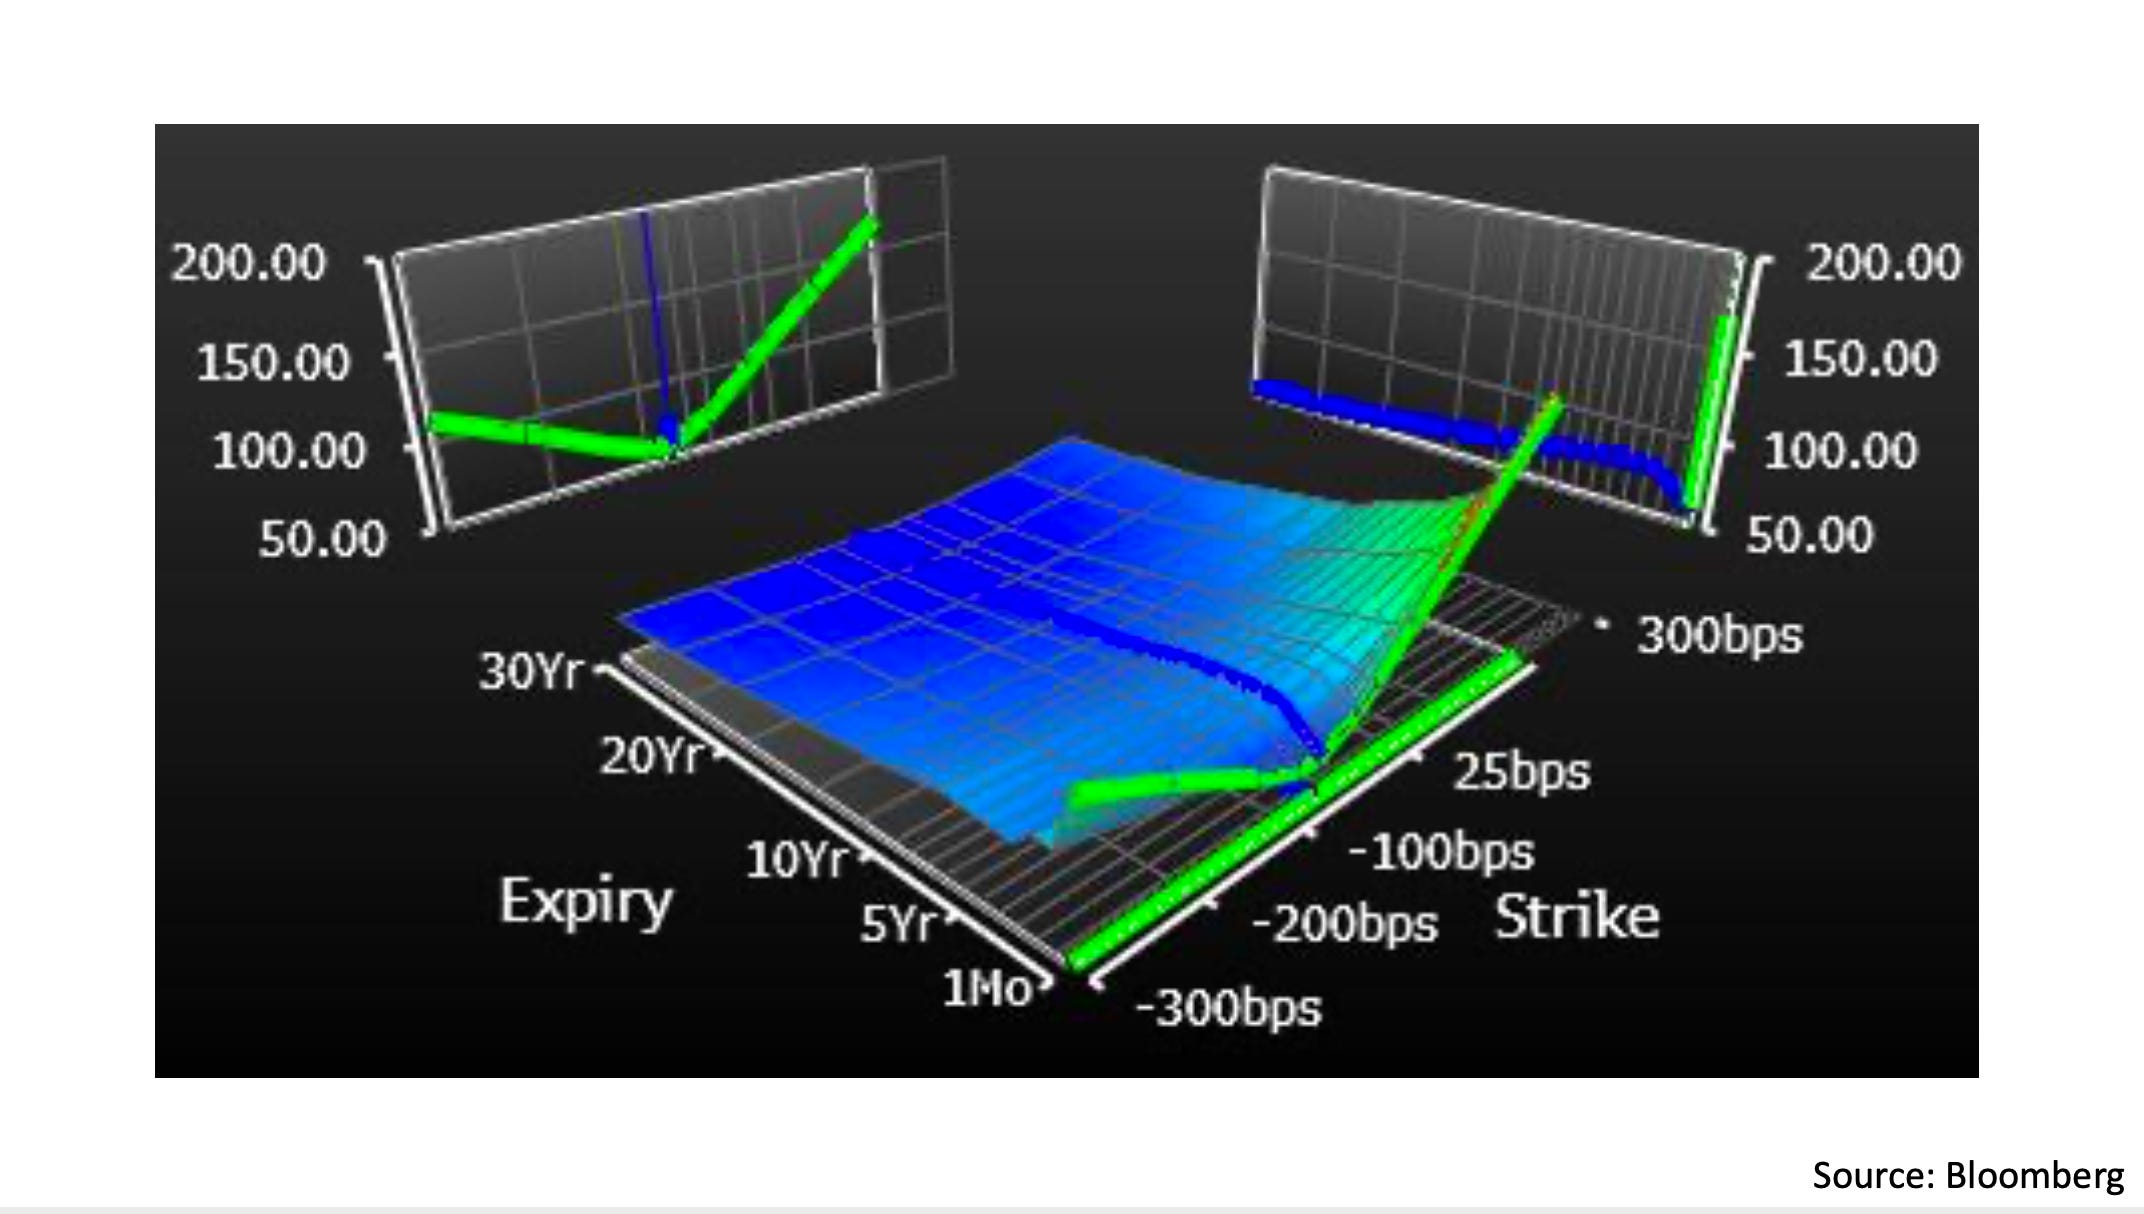
In this chart we see the implied volatility for the 5 year swap, illustrated as the surface rising above the plane of strikes and expiries. The blue line dividing the surface in half and shown on the right side panel represents the at-the-money implied volatility, for swaptions with underlying fixed rate at the current market rate. The green line along the near end of the surface and shown on the left side panel is the 1 month implied volatility across strikes.
While we cannot see the blue line very clearly in this chart, the green line does display the characteristic smile and skew that will feature heavily in some of the following charts. The smile refers to implied volatility being higher the further from at-the-money strikes in either direction. The intuition here is that a short term swaption with strike at 300bps above or below the current levels is effectively a hedge against extreme tail events in rates. The rates volatility market, like the equity volatility market usually, assigns ‘fat tail’ probabilities to these events, so implied volatility along these edges of the cube is usually higher than at-the-money. The skew refers to the implied volatility on the rates upside being higher vs the rates downside, making the ‘smile’ slanted on the chart as opposed to symmetrical. The logic here is that rates have been rising this year, so prices for swaptions that could hedge against further upside in rates are elevated. Now that we have a general idea of how the volatility cube works, let’s look at some more cuts, starting with the 1 year swap.
1Y Swap Implied Volatility
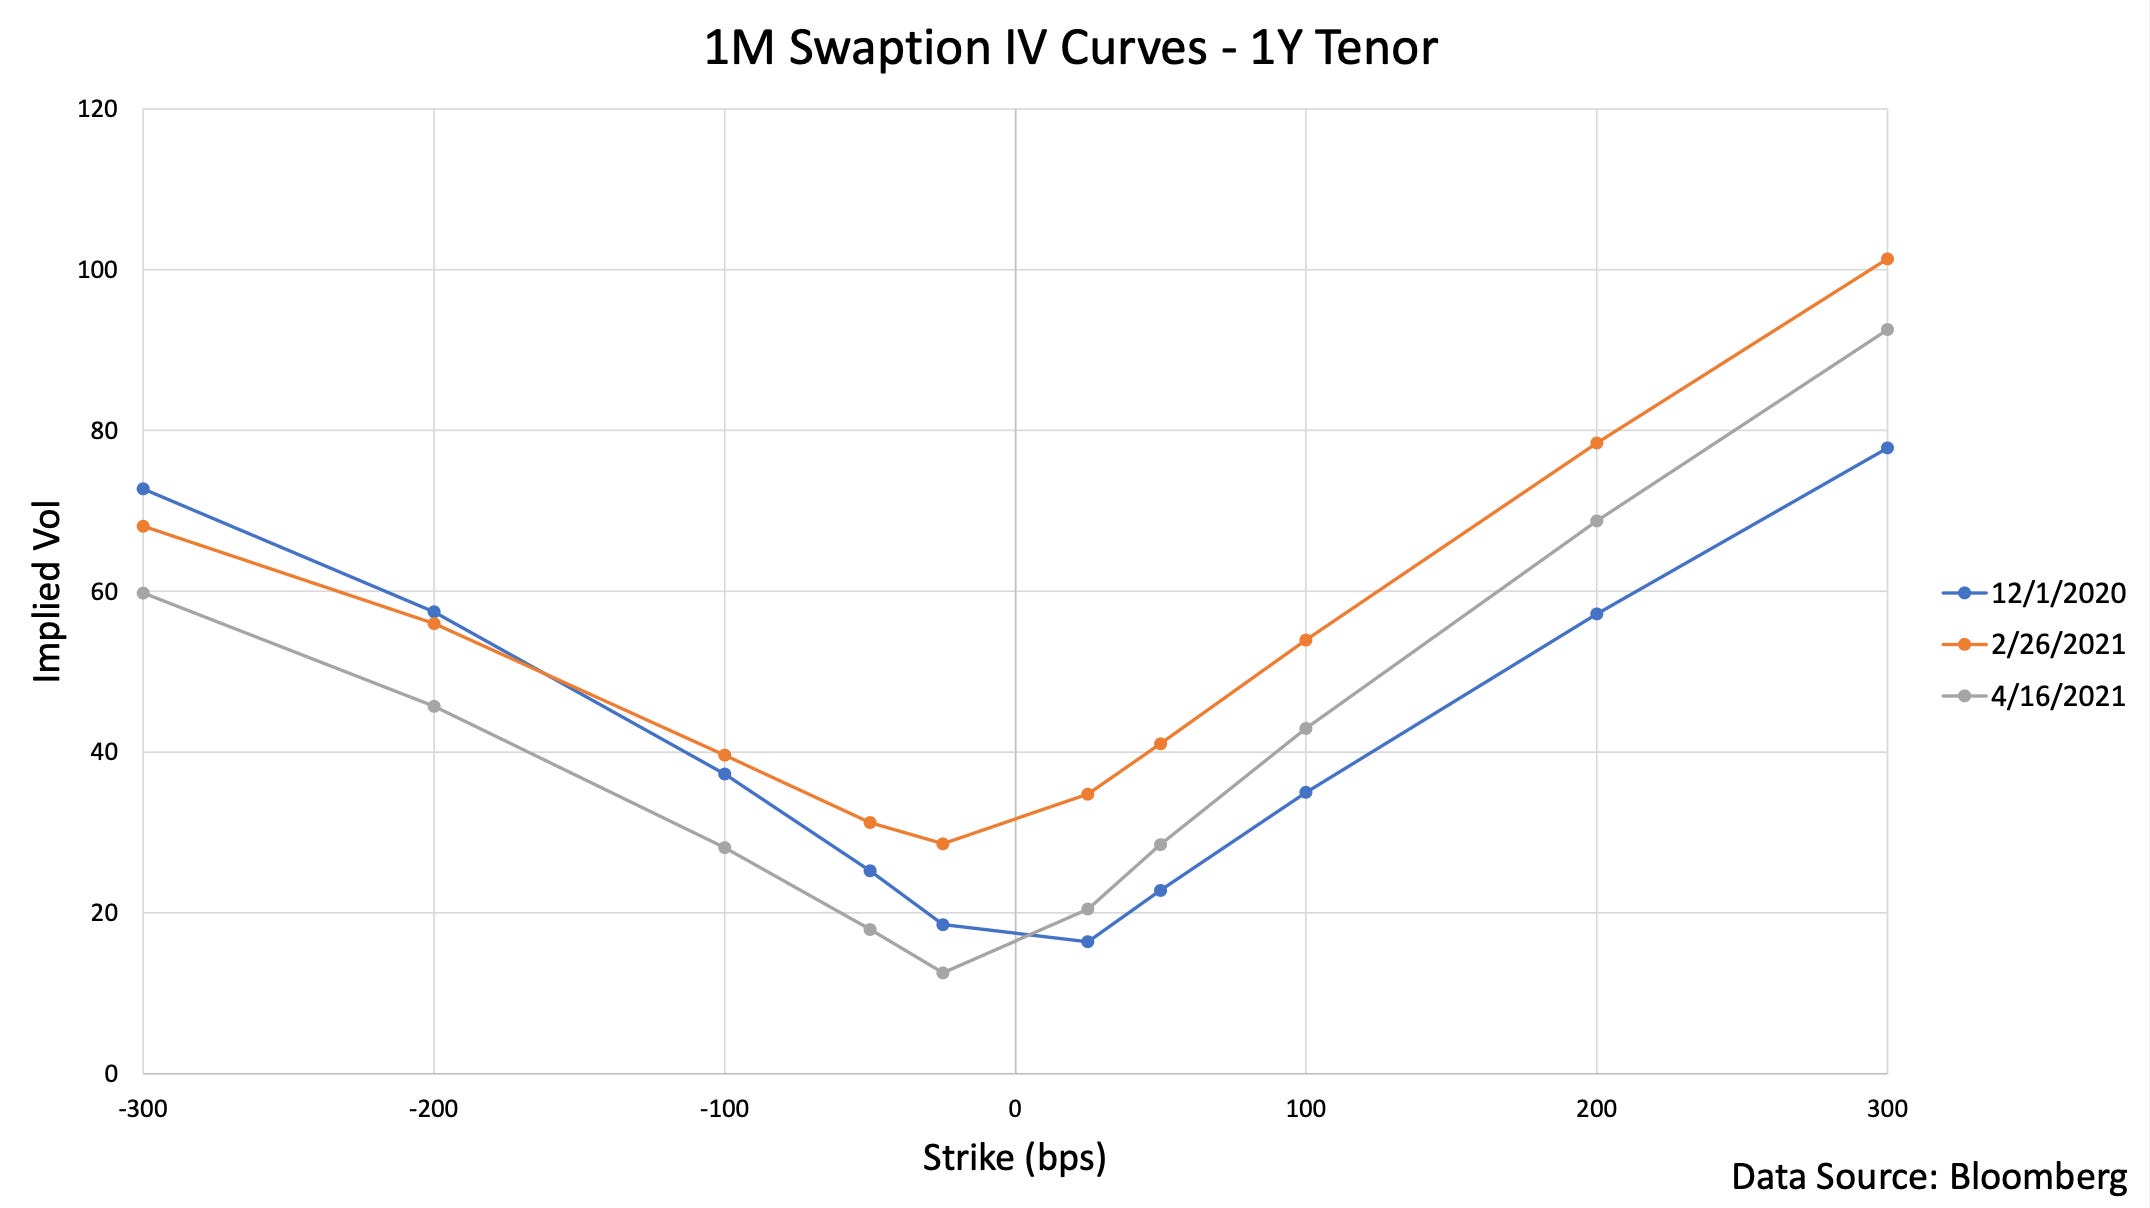
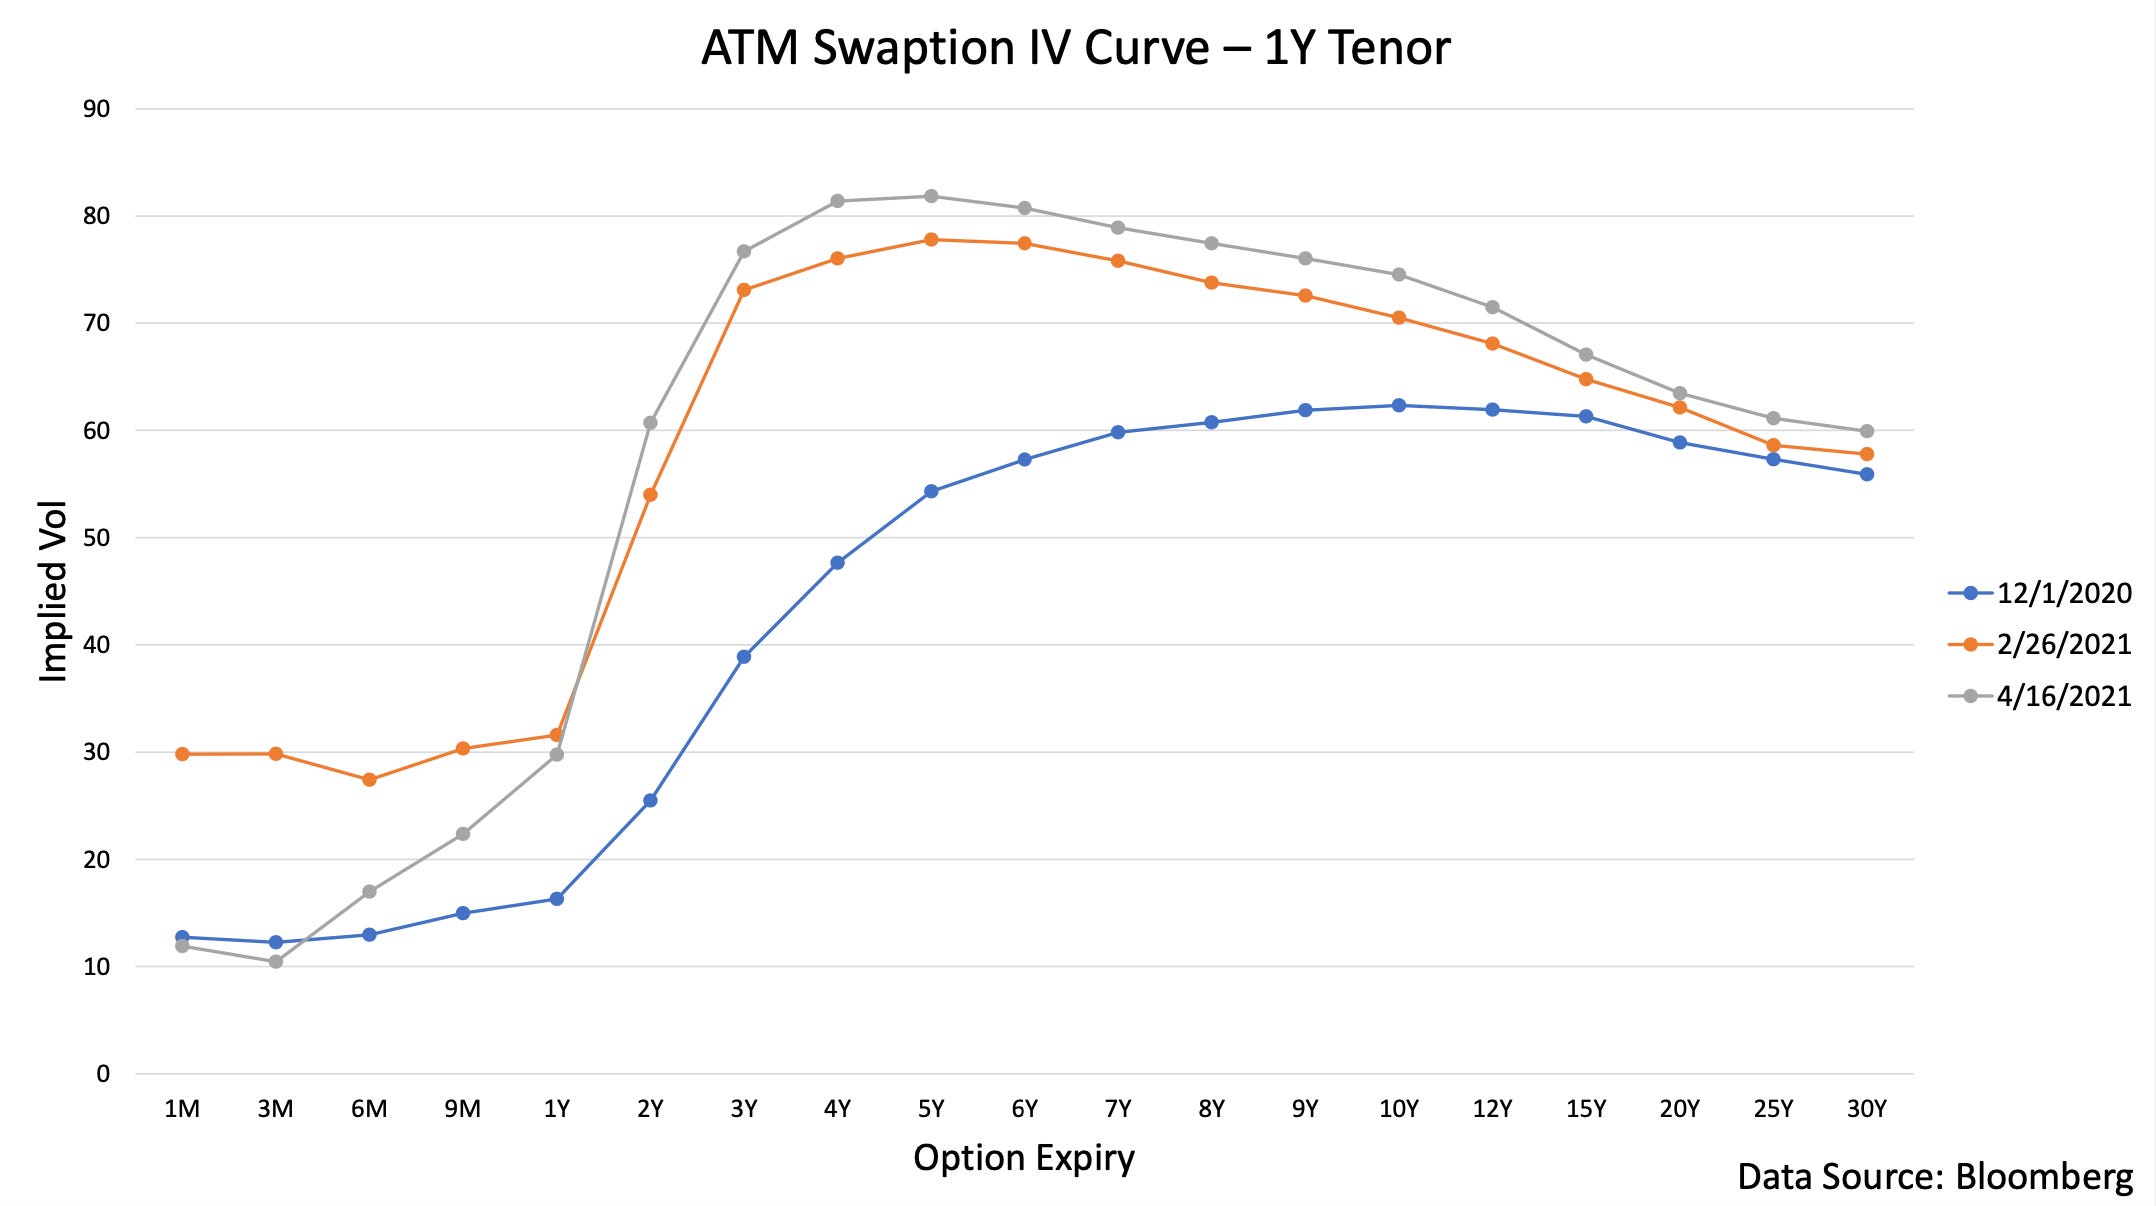
The chart above shows the implied volatility of the 1 year swap based on the 1 month-to-expiry swaptions at three points in time. The strikes shown here are relative to the at-the-money rate, so the curves are re-centered over time as rates change (for ease of comparison). The blue line, from December of last year, shows only modest skew, with the upside strikes trading just slightly above the downside strikes in implied volatility. This is reasonable in the context of late-2020 as 1 year rates were not expected to move very much in the near future, so besides the typical smile there was no reason for 1 month swaptions to lean in any particular direction. On the other hand, the orange line from February 26 of this year (immediately after the bond flash crash of February 25), shows extreme skew. Though 1 year swap rates remained anchored below 25bps during the crash and since then, swaptions far to the upside reacted to the possibility of rates rising further, while swaptions to the downside actually traded cheaper. Finally, the grey line from today shows that implied volatility has come down across the board since late-February, but significant skew still remains. This is likely a sign that demand to hedge upside risks in rates still remains while the market has calmed a bit overall. Let’s switch to another slice of the 1 year swap volatility surface, but now across different option expiries.
In this chart we have the at-the-money implied volatility of the 1 year swap across swaptions ranging from 1 month to 30 years from expiry, at the close of the same three trading days. The blue line shows a fairly typical term structure for the 1 year swap during a 0% policy rate period. The market is fairly certain short term rates will not go negative or rise in the near future, so at-the-money swaptions out to about 1 year-to-expiry trade at very low implied volatility. The curve steepens around 2 years-to-expiry and levels off around 7 years-to-expiry, with longer term implied volatility priced at a roughly constant level. The February 26 curve again shows a significant dislocation, with the front end and medium term implied volatilities rising, while only the long end of the curve remained relatively anchored. In today’s curve, the front end has collapsed back to extremely low implied volatility, as the market priced in the fact that 1 year rates were probably still not going anywhere in the immediate future. However starting from the late-2021 expiries there is a steepening and the 3 year to 6 year expiries remain extremely elevated (even more so than in February). This makes sense given that uncertainty about where 1 year swap rates will be during that stretch of time remains high, due to them being highly driven by the level of policy rates.
Now let’s move on to swaptions on longer term swaps as we move up the ‘underlying duration’ axis of the volatility cube. The relevant dates and chart formats in these next two sections will be the same as in this one, so the only differences will be the tenor of the underlying swap. Then, the final section will contain a review of the trading action of February 25 that may have contributed to some of the dislocations here.
5Y Swap Implied Volatility
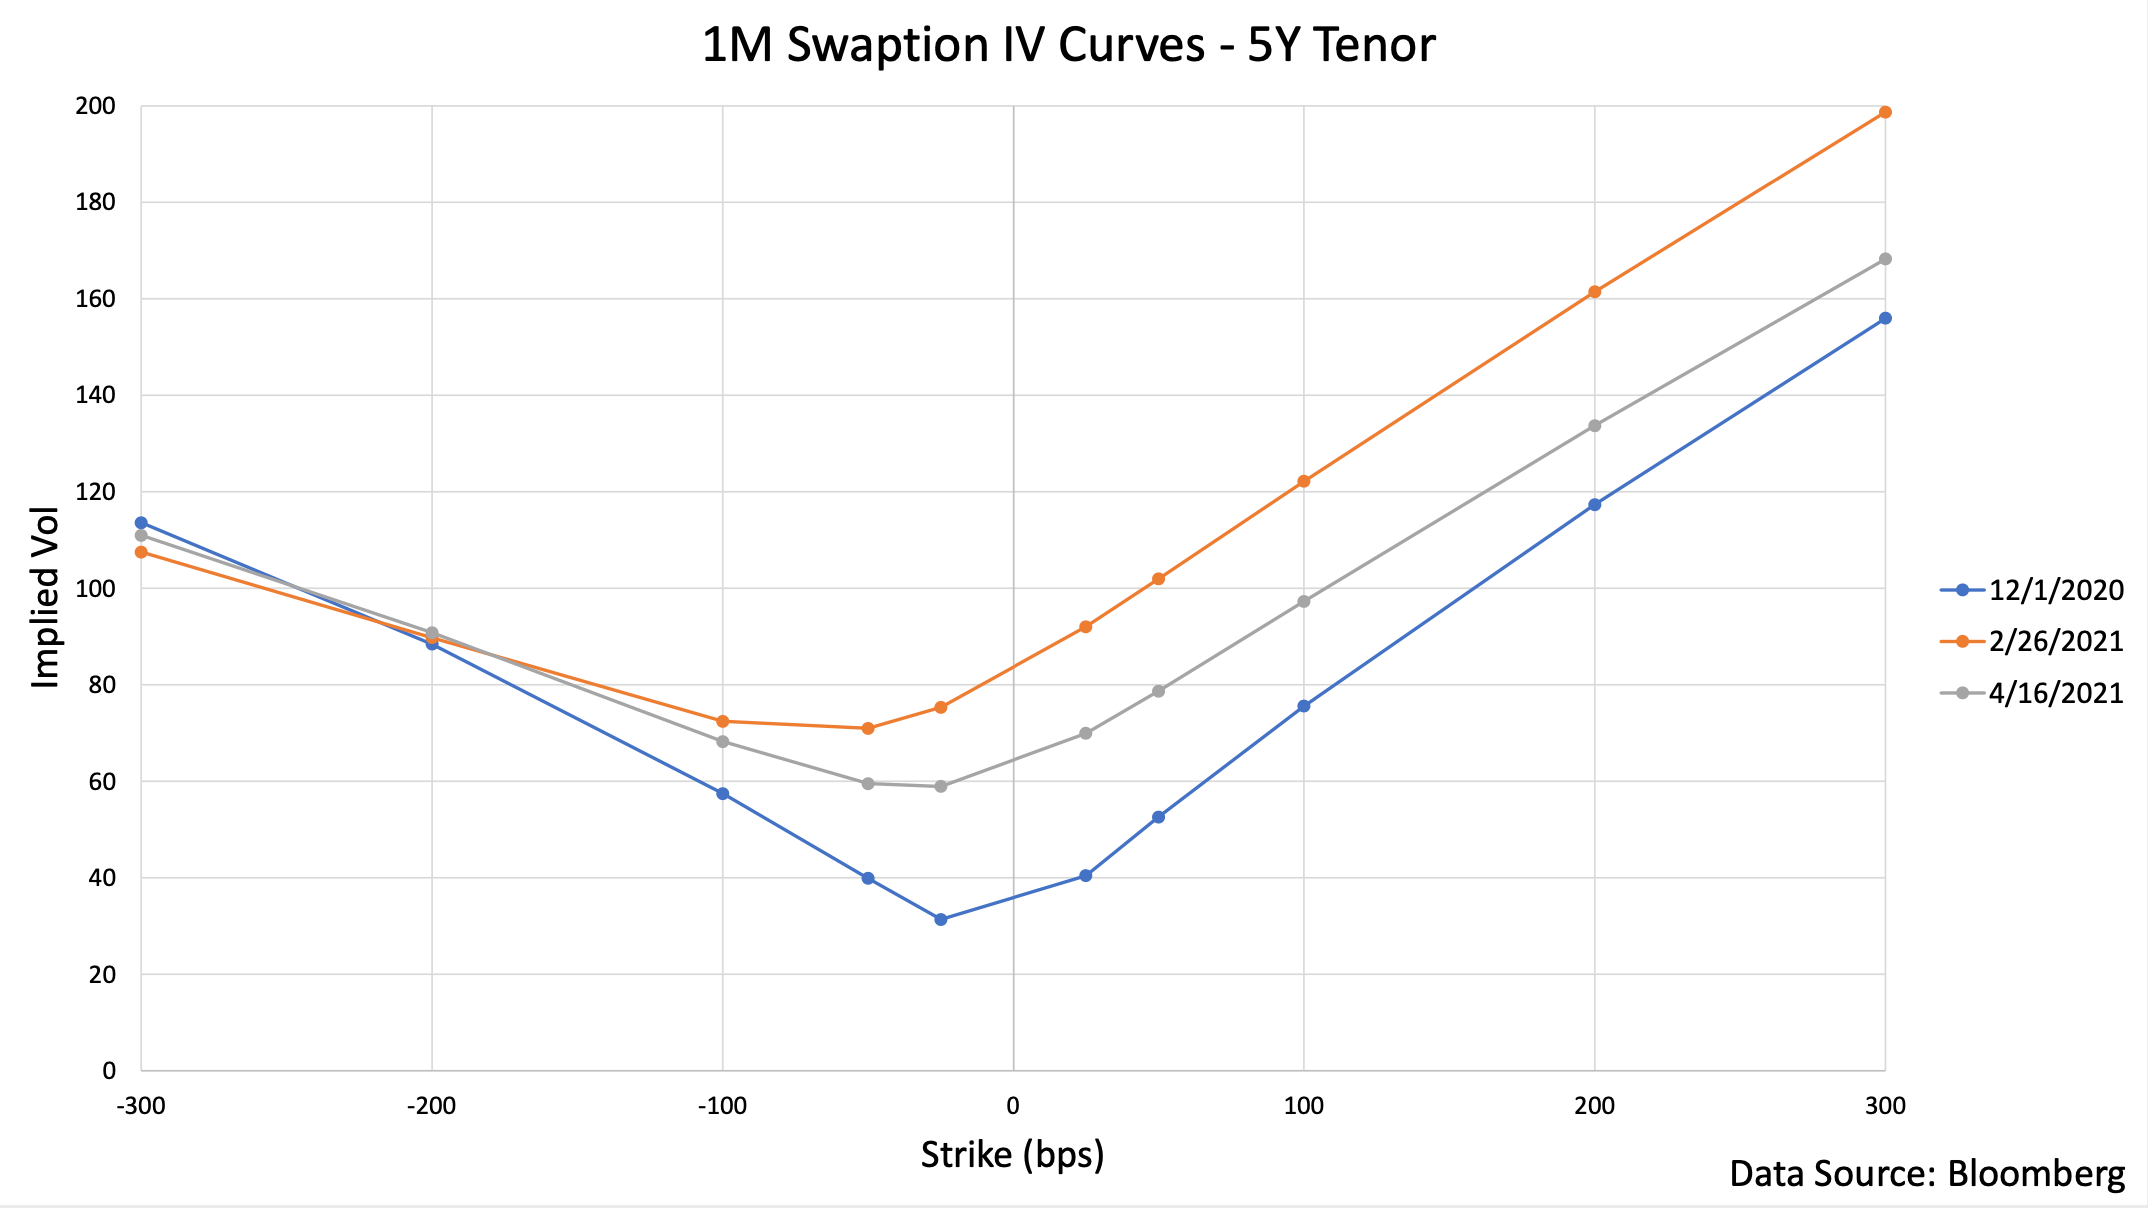
The chart here shows the 1 month implied volatilities for the 5 year swap on the same three dates and across the same range of strikes around at-the-money in the center. The December curve already showed some more significant skew here, suggesting that the market was at least somewhat pricing in the possibility of 5 year rates rising soon. By February 26 the skew had gotten extreme, with upside implied volatility almost double the downside values for some strikes the same distance from at-the-money. This is understandable given how hard hit 5 year maturities were during the bond crash of the previous day, suggesting the market was willing to pay extreme prices to hedge further upside tail events in 5 year rates. Since then the skew has come down somewhat, though it remains more pronounced than it was in December and the at-the-money implied volatility remains significantly higher. This suggests that the market is still uncertain about 5 year rates in the near term, but the uncertainty has come down from its earlier peak at least temporarily.
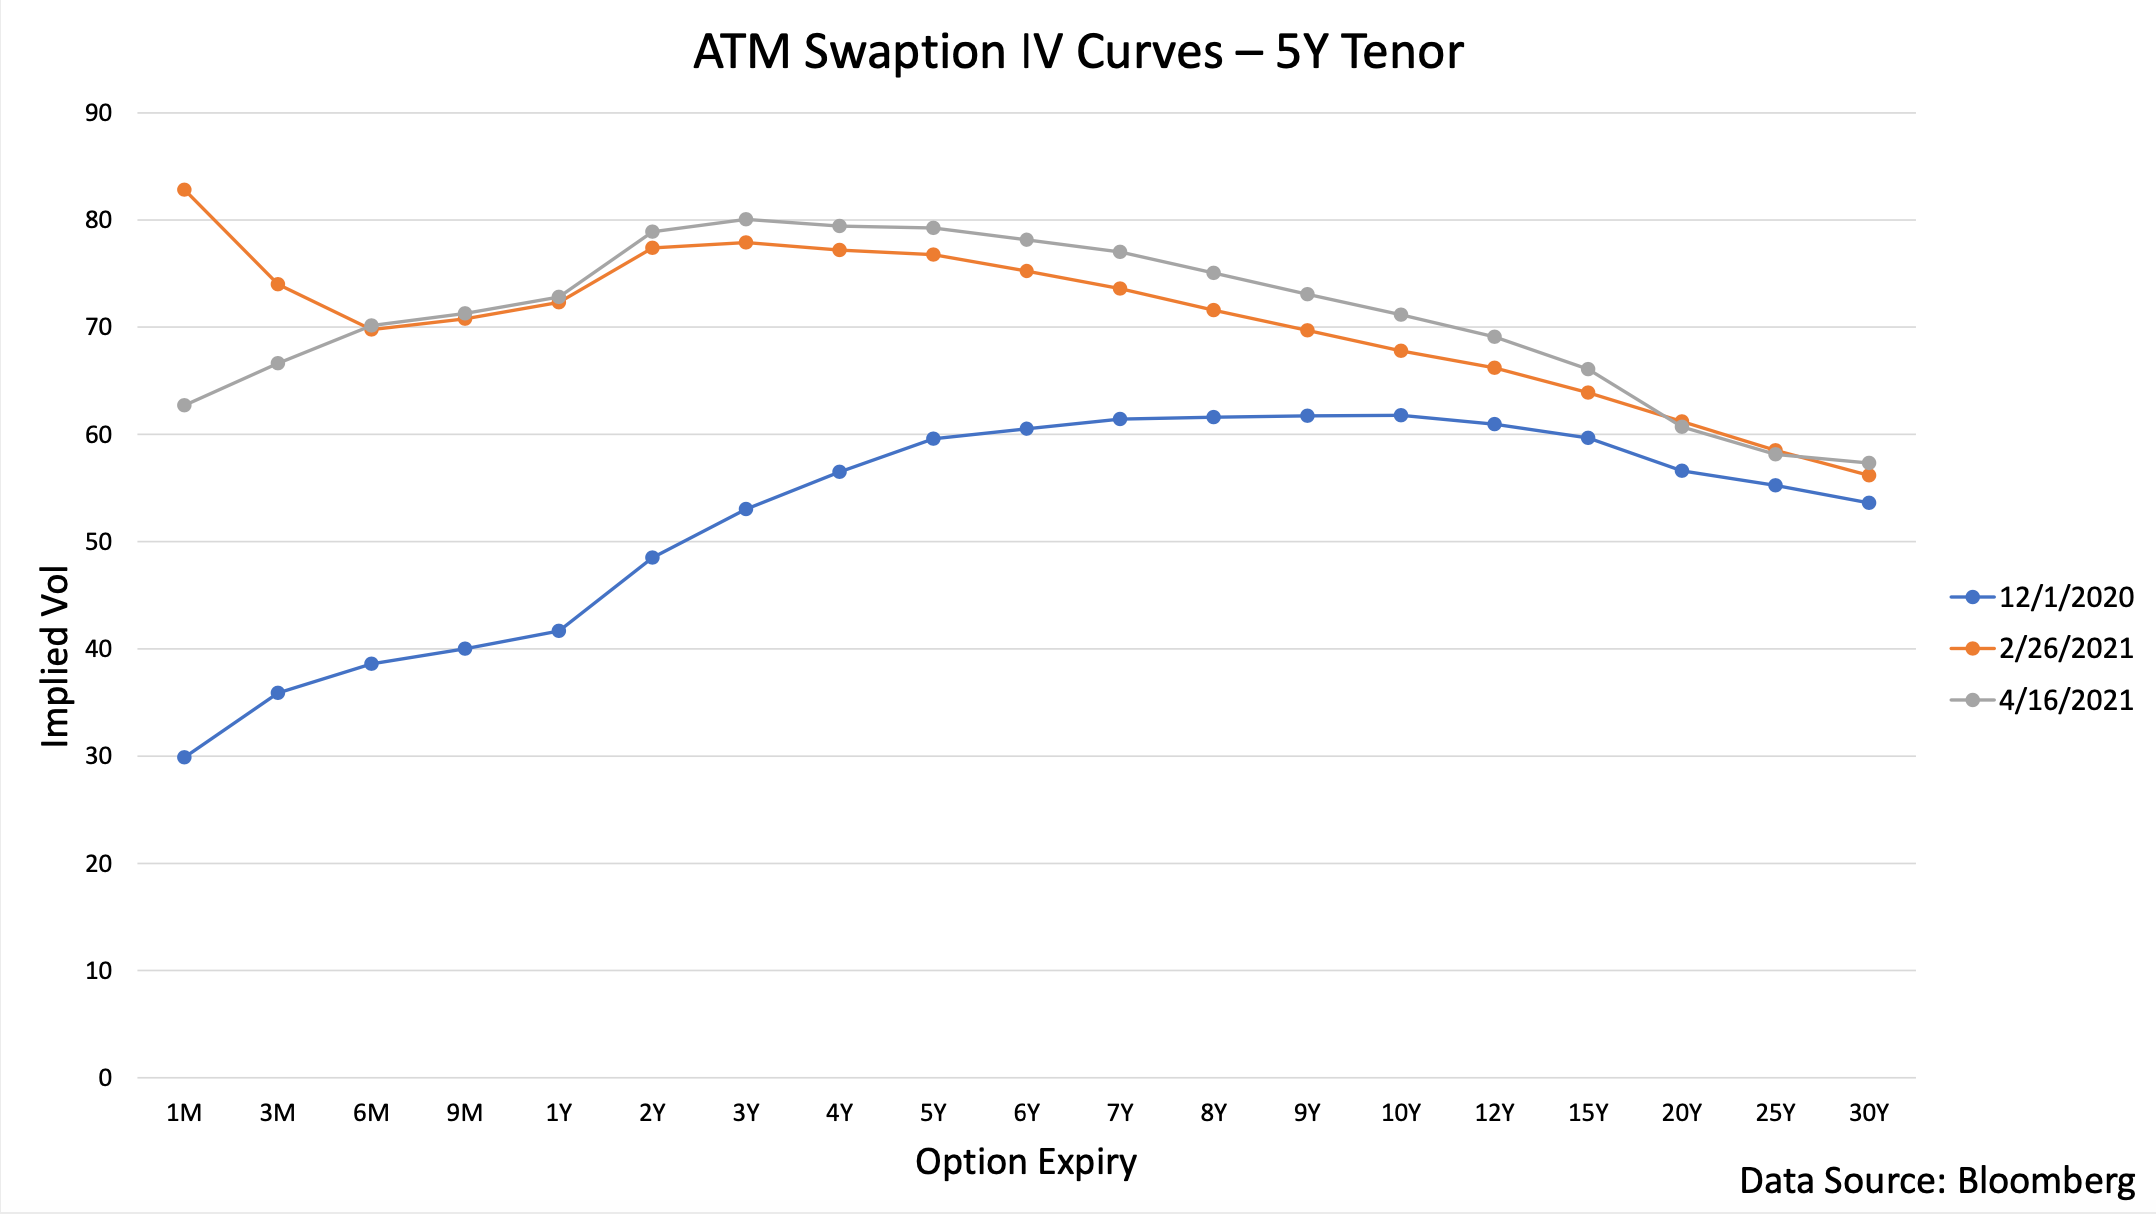
Now looking at the term structure of implied volatility across a range of expiries, the December curve here shows a slightly milder version of the similar curve shown earlier for the 1 year swap. Implied volatility out to 1 year-to-expiry is relatively low, followed by a steep area of the curve out to 7 years-to-expiry or so and a fairly flat curve out past that. The low volatility in the near term expiries is not as exaggerated as it is for the 1 year swap as 5 year rates are not so firmly anchored by Fed policy, but the overall term structure was mostly similar in December at least. The February curve here also shows a huge rise in implied volatility across the near term and medium term expiries, with the long term relatively stable. However, there is significant anomaly in the 1 month and 3 month-to-expiry swaptions for the 5 year swap, as they spiked significantly higher in implied volatility than the 6 month through 1 year expiries. This suggests that the market was surprised by the extremely quick rise in 5 year rates and willing to pay heavy premiums to hedge out the risk of immediate moves. In today’s curve this anomaly has disappeared, while the rest of the curve remains relatively unchanged from late-February. This also makes sense as the medium to long term outlook for 5 year rates has probably not changed all that much since then, while the immediate hedging demand has eased.
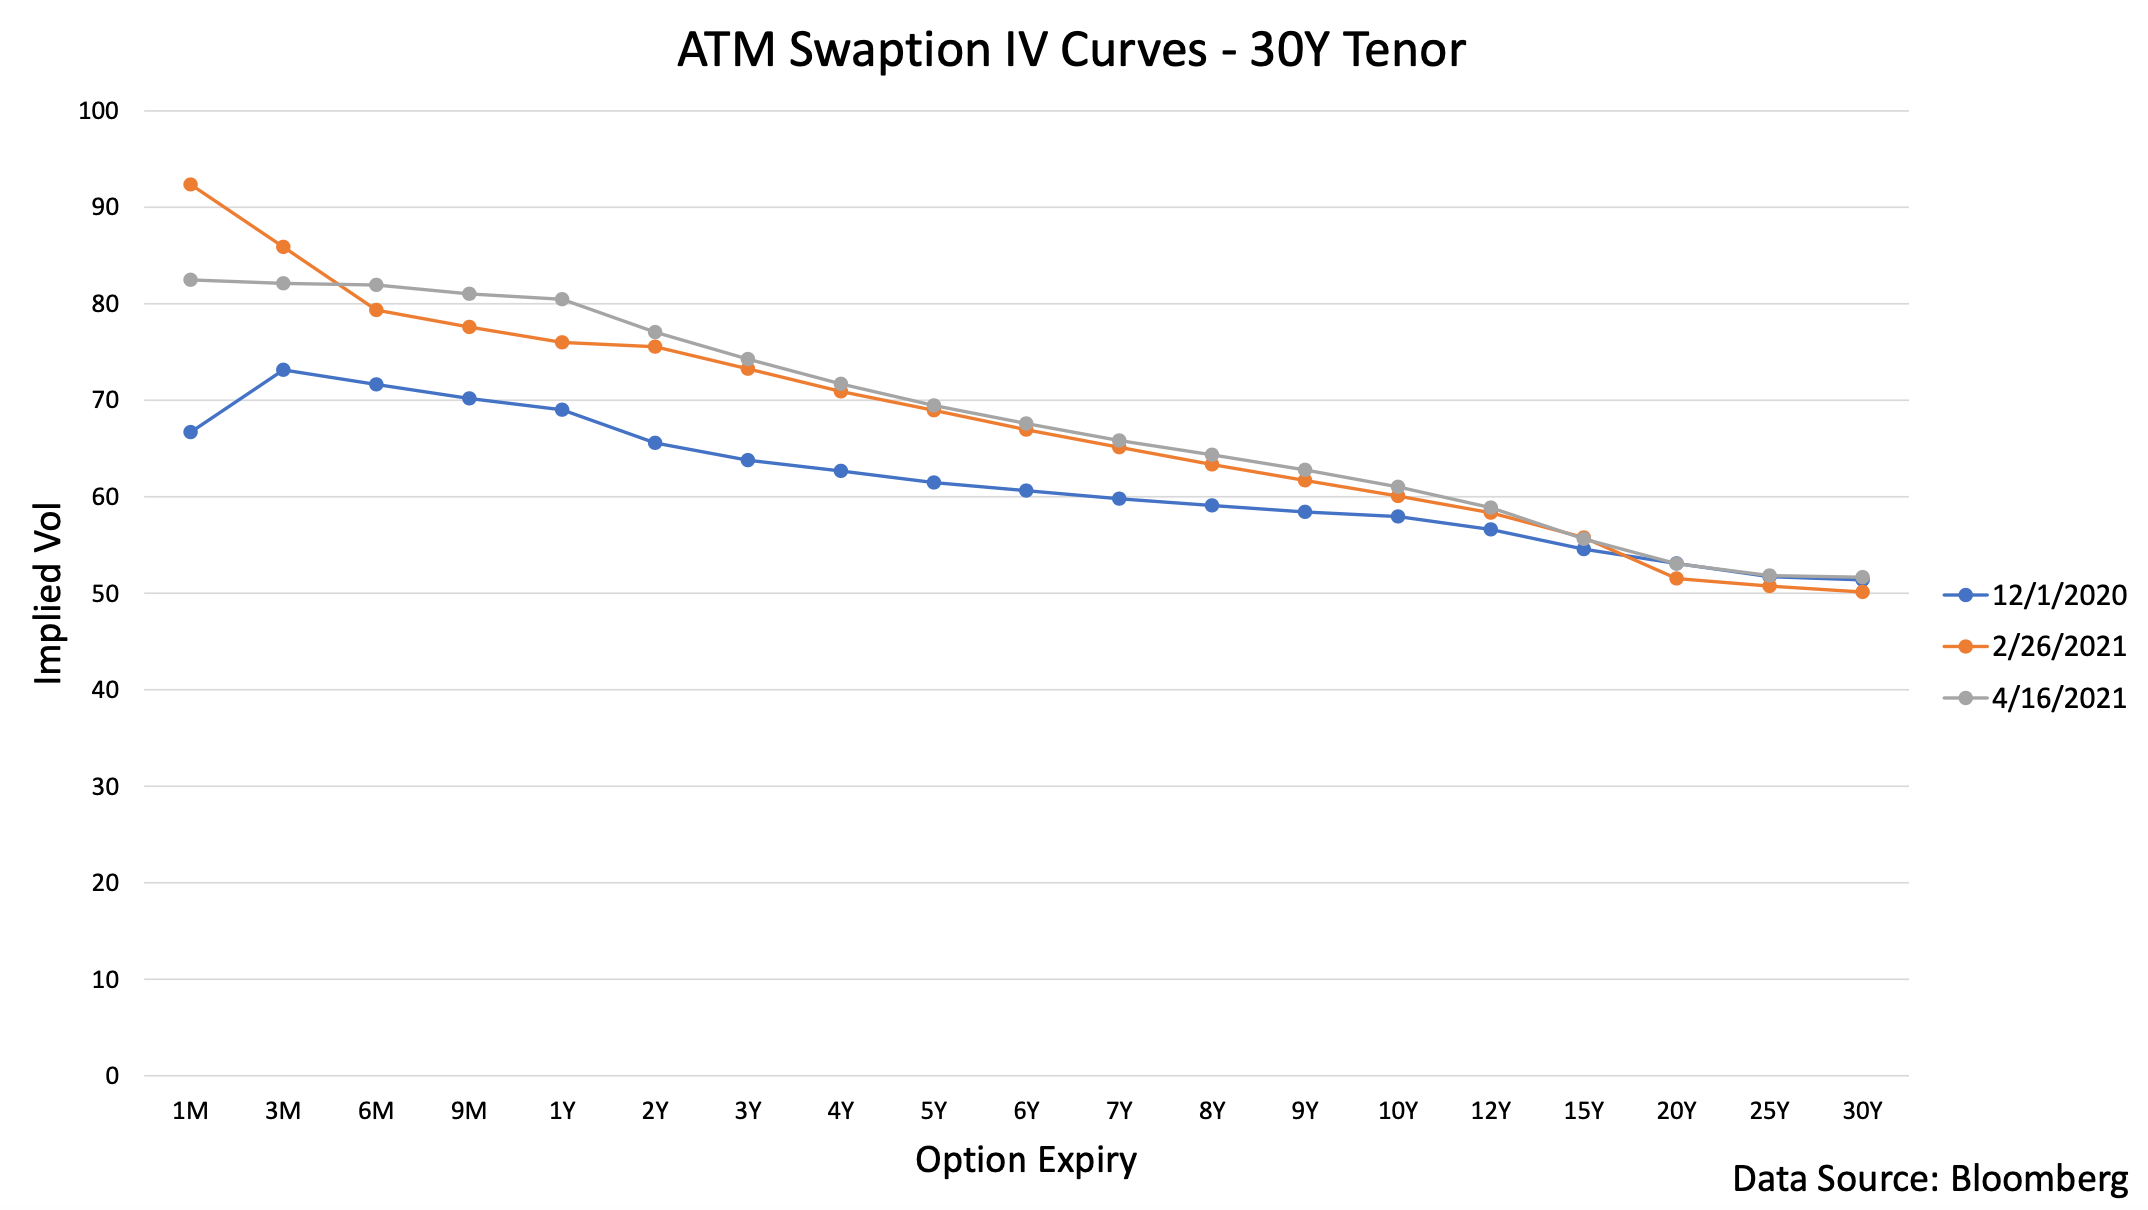
30Y Swap Implied Volatility
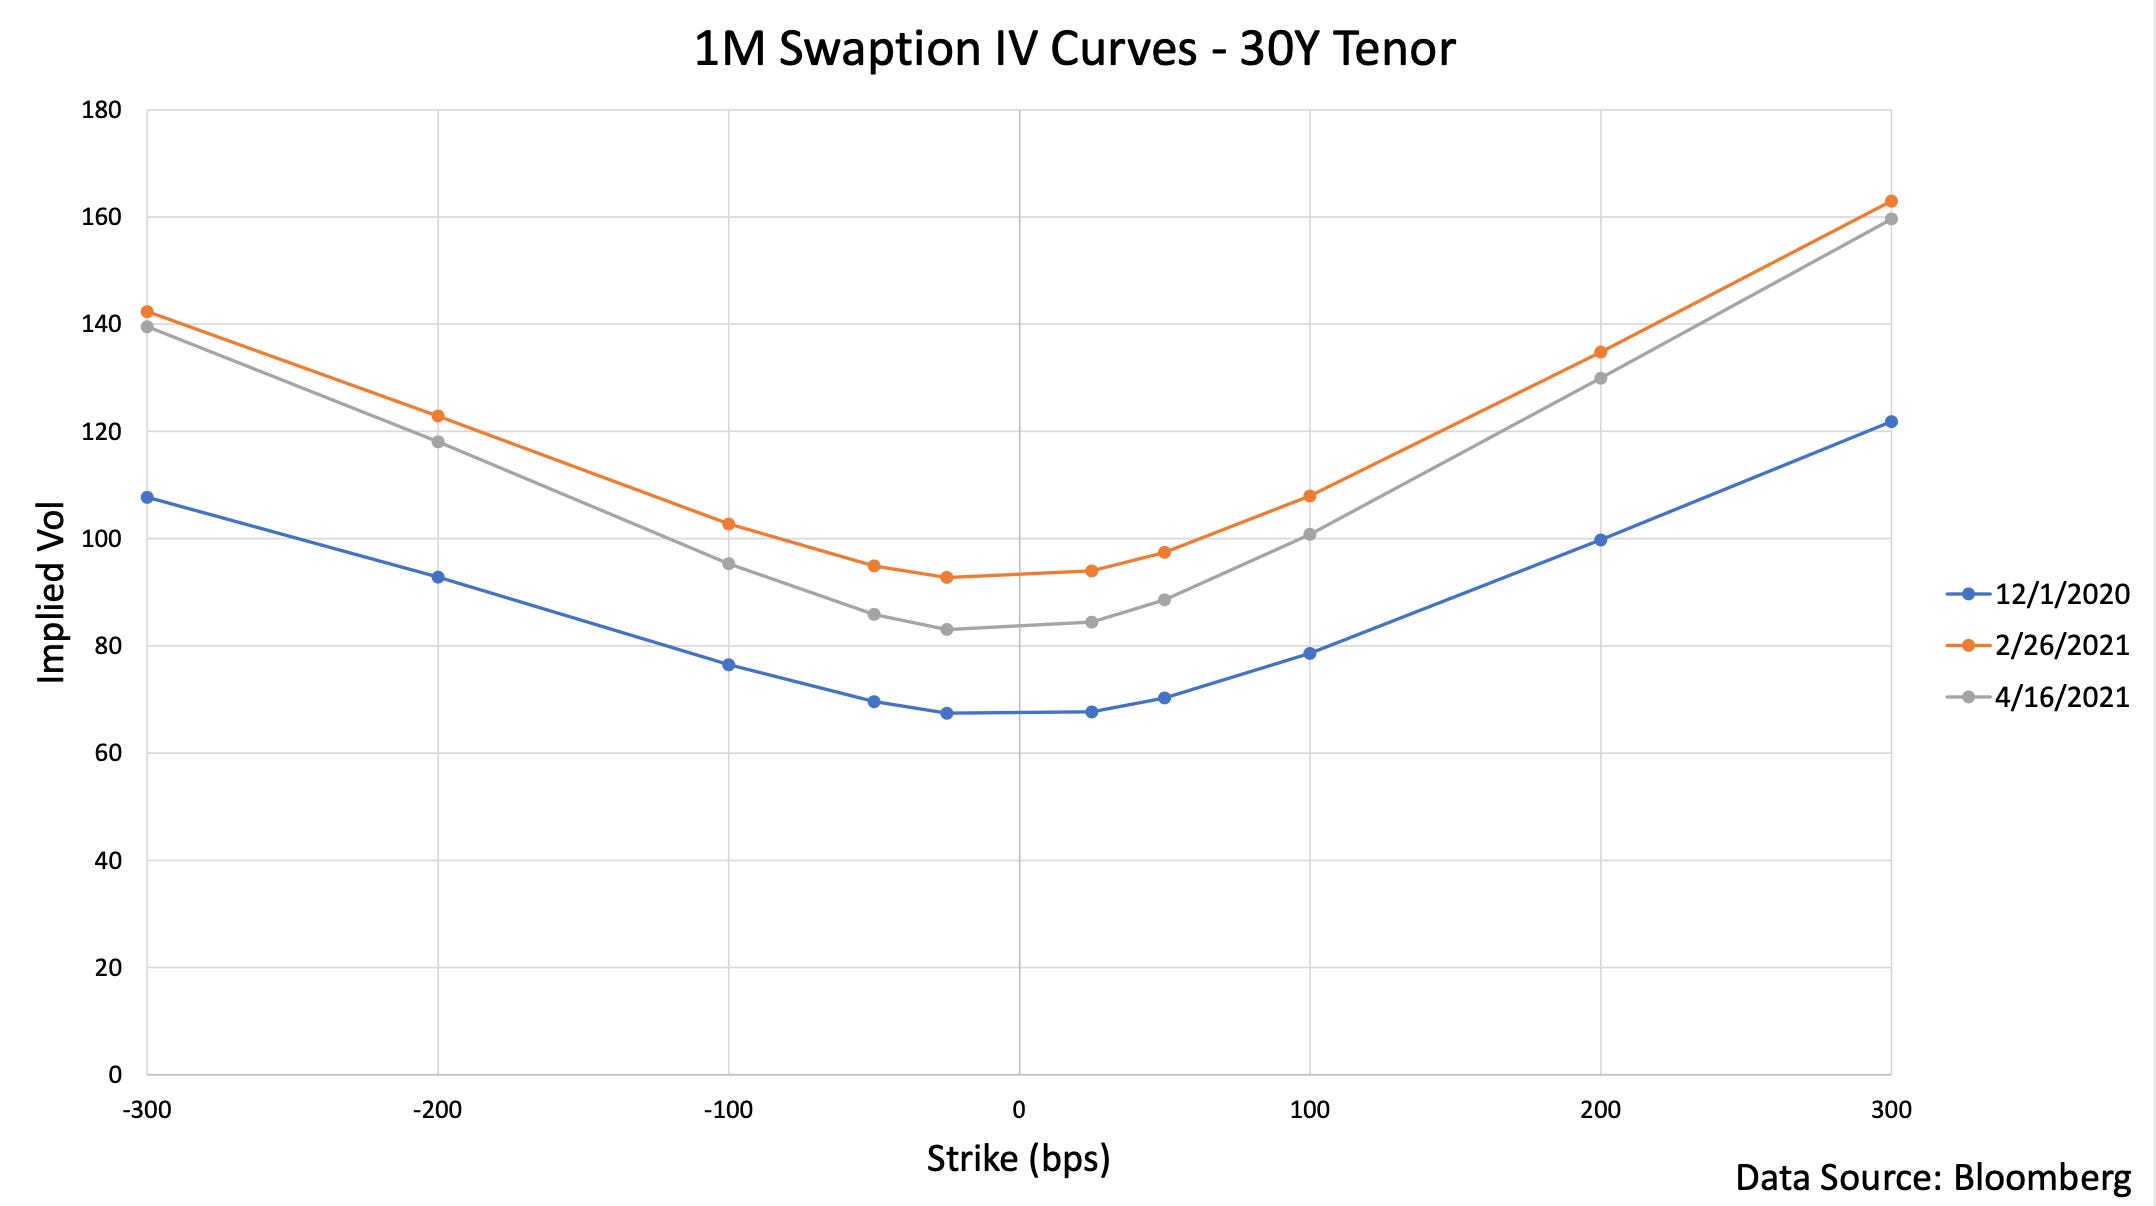
Finally, let’s have a look at 30 year swaps and their implied volatility profile. In this chart we have the 1 month-to-expiry curves at the same dates as the two previous sections. The blue December curve here shows modest smile and skew compared to the two previous maturities we looked at. There was some preference for rates upside hedges in the 30 year swap, but less so than for the 5 year swap especially. In the February curve, this skew became more pronounced, as the entire curve rose led by the far upside strikes. Interestingly, since late-February, the near at-the-money implied volatility here has come down, while the ends of the curve have remained almost unchanged. This suggests that the market is also still willing to pay high premiums to hedge extreme moves in long term rates, while overall uncertainty has come down a bit.
Now looking at the at-the-money term structure for the 30 year swap, we start with a very different December curve than for the shorter swaps discussed previously. Though the 1 month-to-expiry implied volatility is slightly lower, suggesting the market was pricing in a relatively calm December, the curve further out is downward sloping. This implies the market expected long term rates volatility to be high in the near future, but fade slightly over time. The February curve here shows the same anomaly in the 1 month and 3 month-to-expiry swaptions that we saw for the 5 year swap, suggesting extreme hedging demand was present there too. Since then, the curve out to 1 year-to-expiry has flattened out, though the downward slope past that point remains. This again tells us that while the acute dislocation in the market has faded, 30 year rates volatility is still expected to be higher in the near future than in the long term.
Feb 25 Swaption Trades
Now, let’s wrap up by looking at some of the trading action on February 25 that may have contributed to some of these extreme moves!
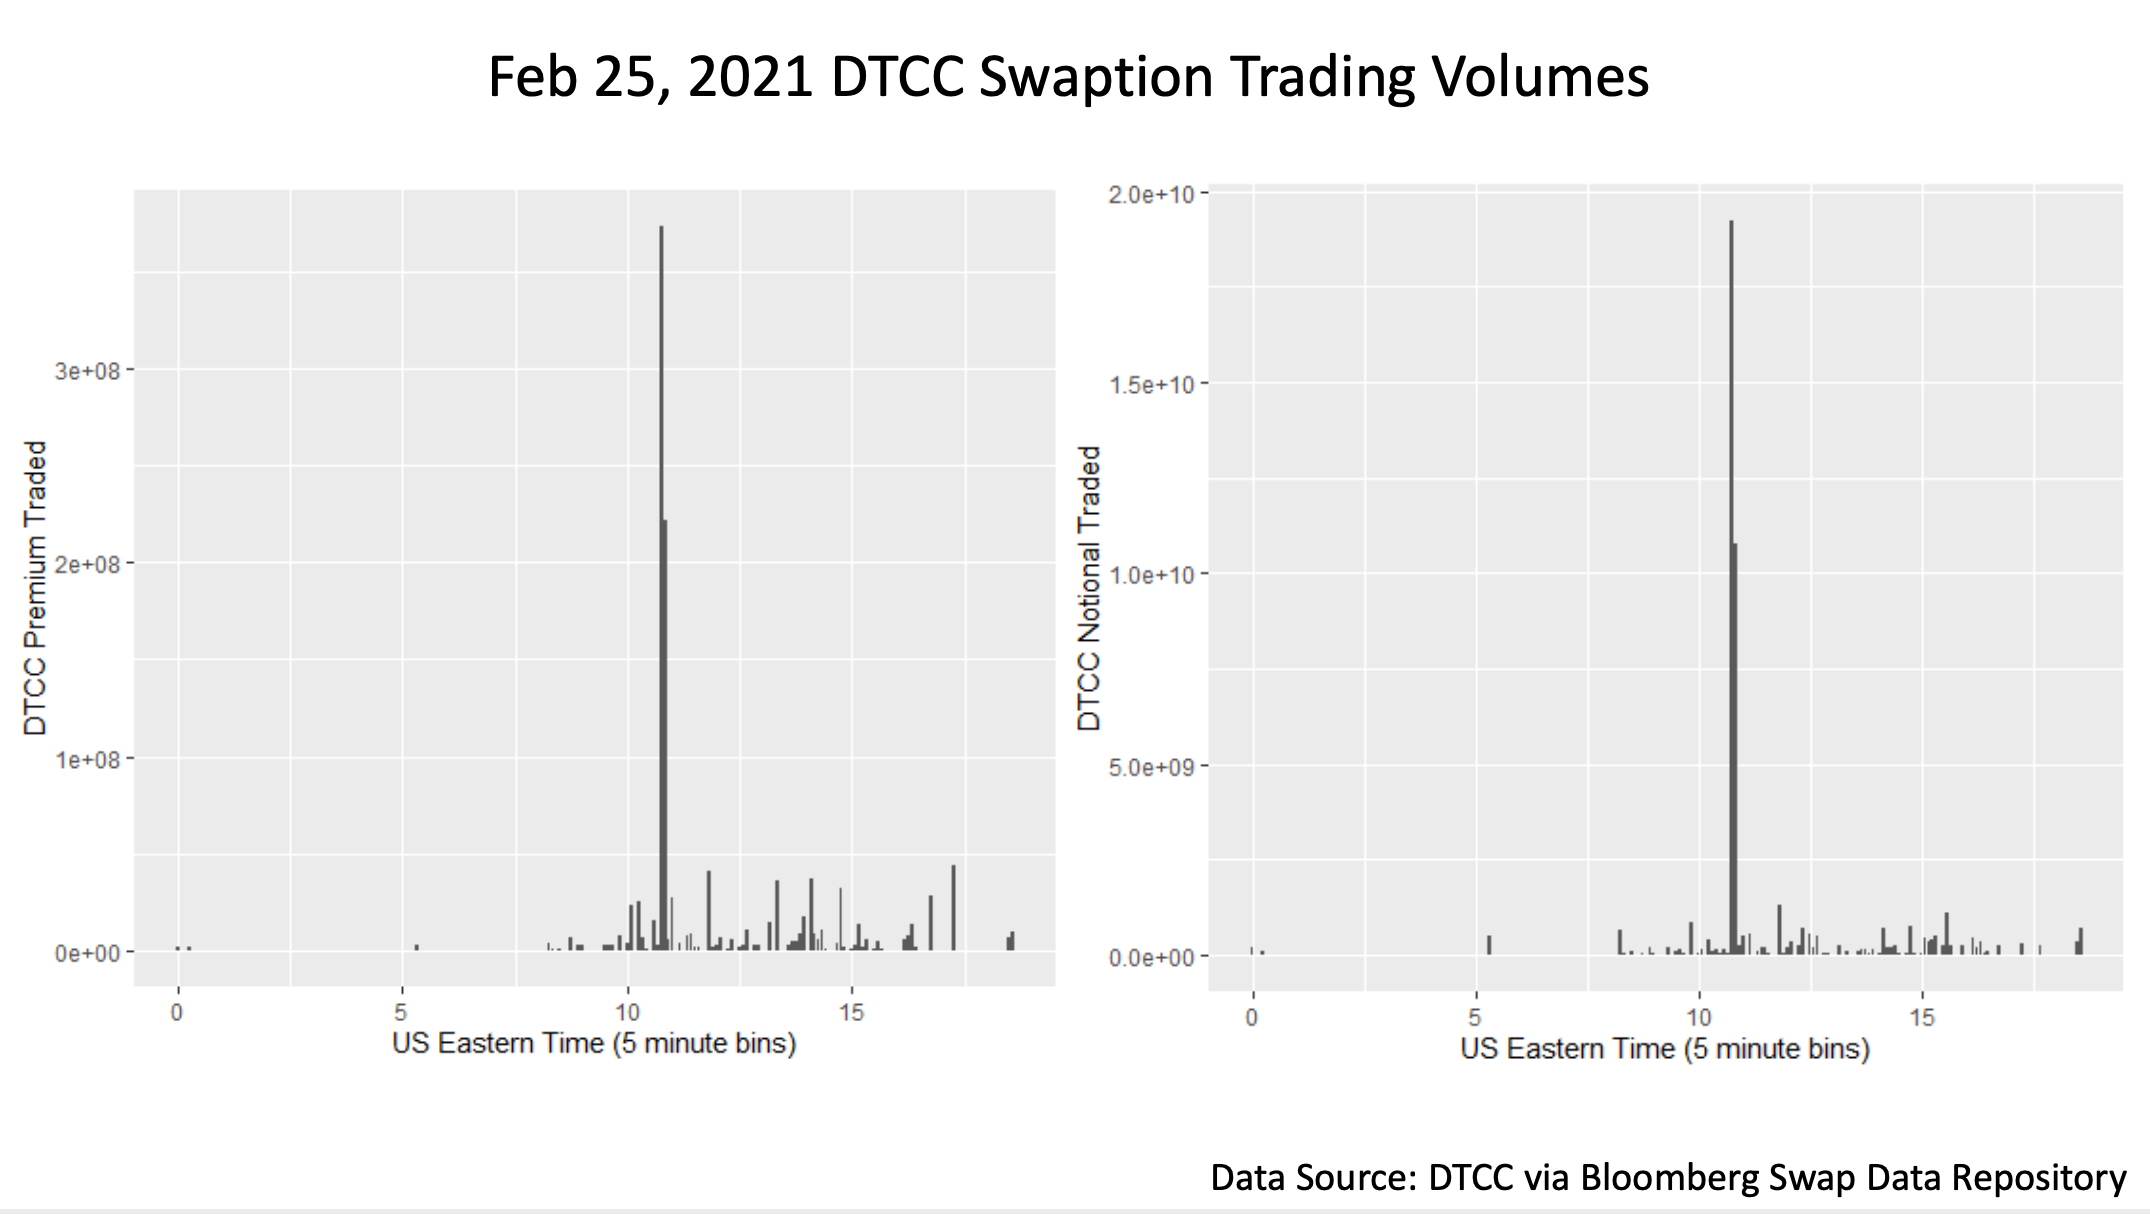
In this chart, we see volumes of interest rate swaptions traded through DTCC on that day grouped into 5 minute bins. The clear outlier here is a brief period right around 11am Eastern time where $100s of millions in swaption premium and $10s of billions in underlying notional traded in just a few minutes. Note that this data only shows the portion of overall swaption volume reported to the Bloomberg Swap Data Repository and is filtered to remove trades where only partial data was available, so overall volumes were probably somewhat higher than this. Still, the period around 11am is very exceptional, so let’s look at it more closely.
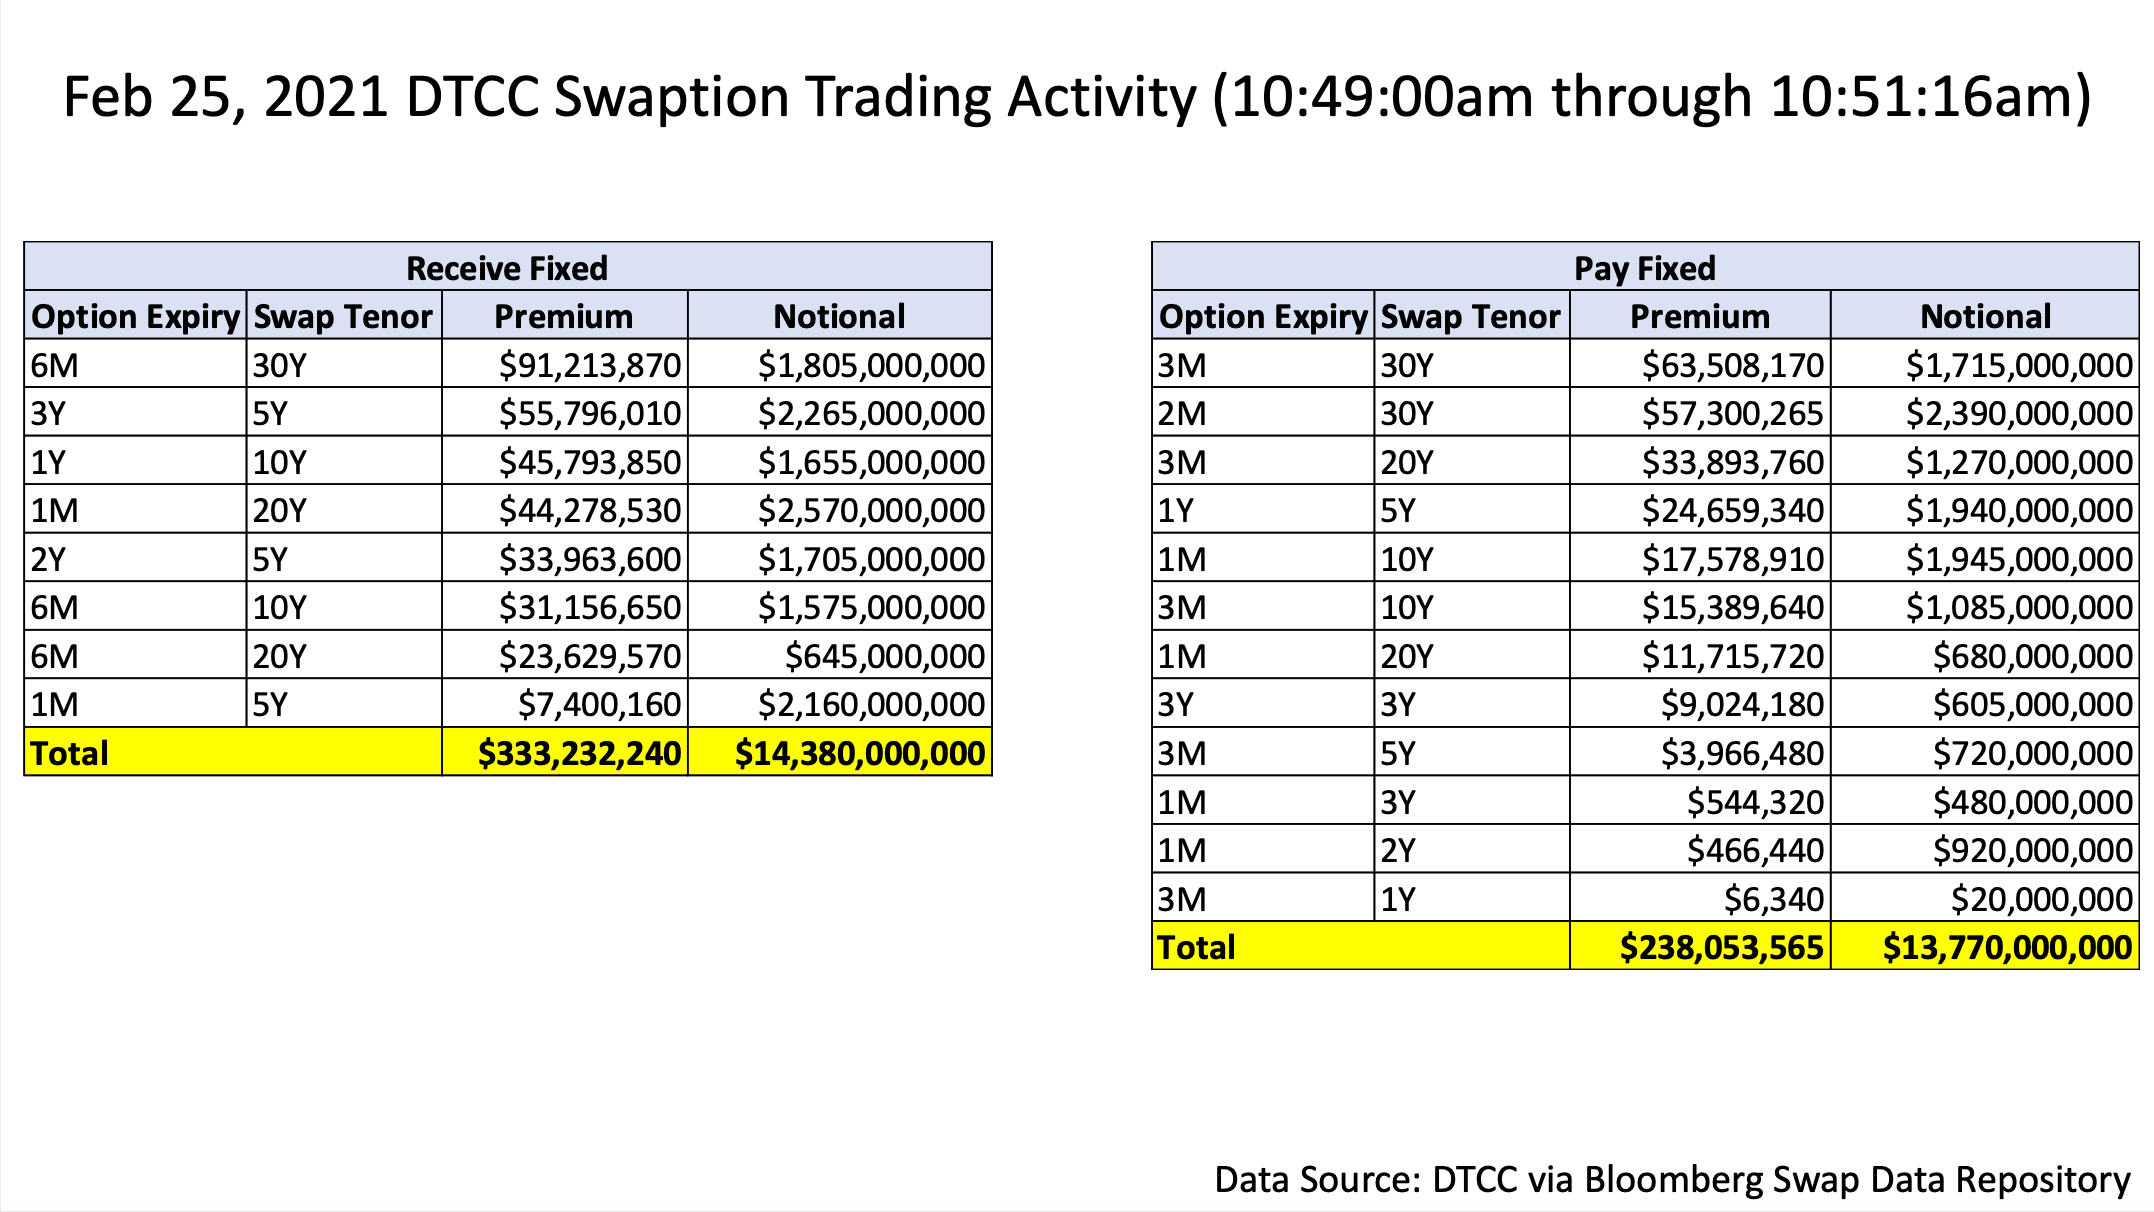
This pair of tables show the aggregated volumes for over 200 trades that happened during a ~2 minute period around 11am that saw the highest burst in volume. While it is difficult to infer the specific positions relevant here without looking at more detail, the roughly matched volumes in near-expiry swaptions on 5 year, 10 year, 20 year, and 30 year swaps in either direction suggests this may have been driven by the hedging of a large, duration heavy portfolio. This would also line up with the spikes in 1 month to 3 month-to-expiry implied volatilities we saw in the earlier charts. The smaller volume trades with 1 year to 3 year underlying swaps were probably unrelated, though again it is impossible to know for sure without looking at more detail.
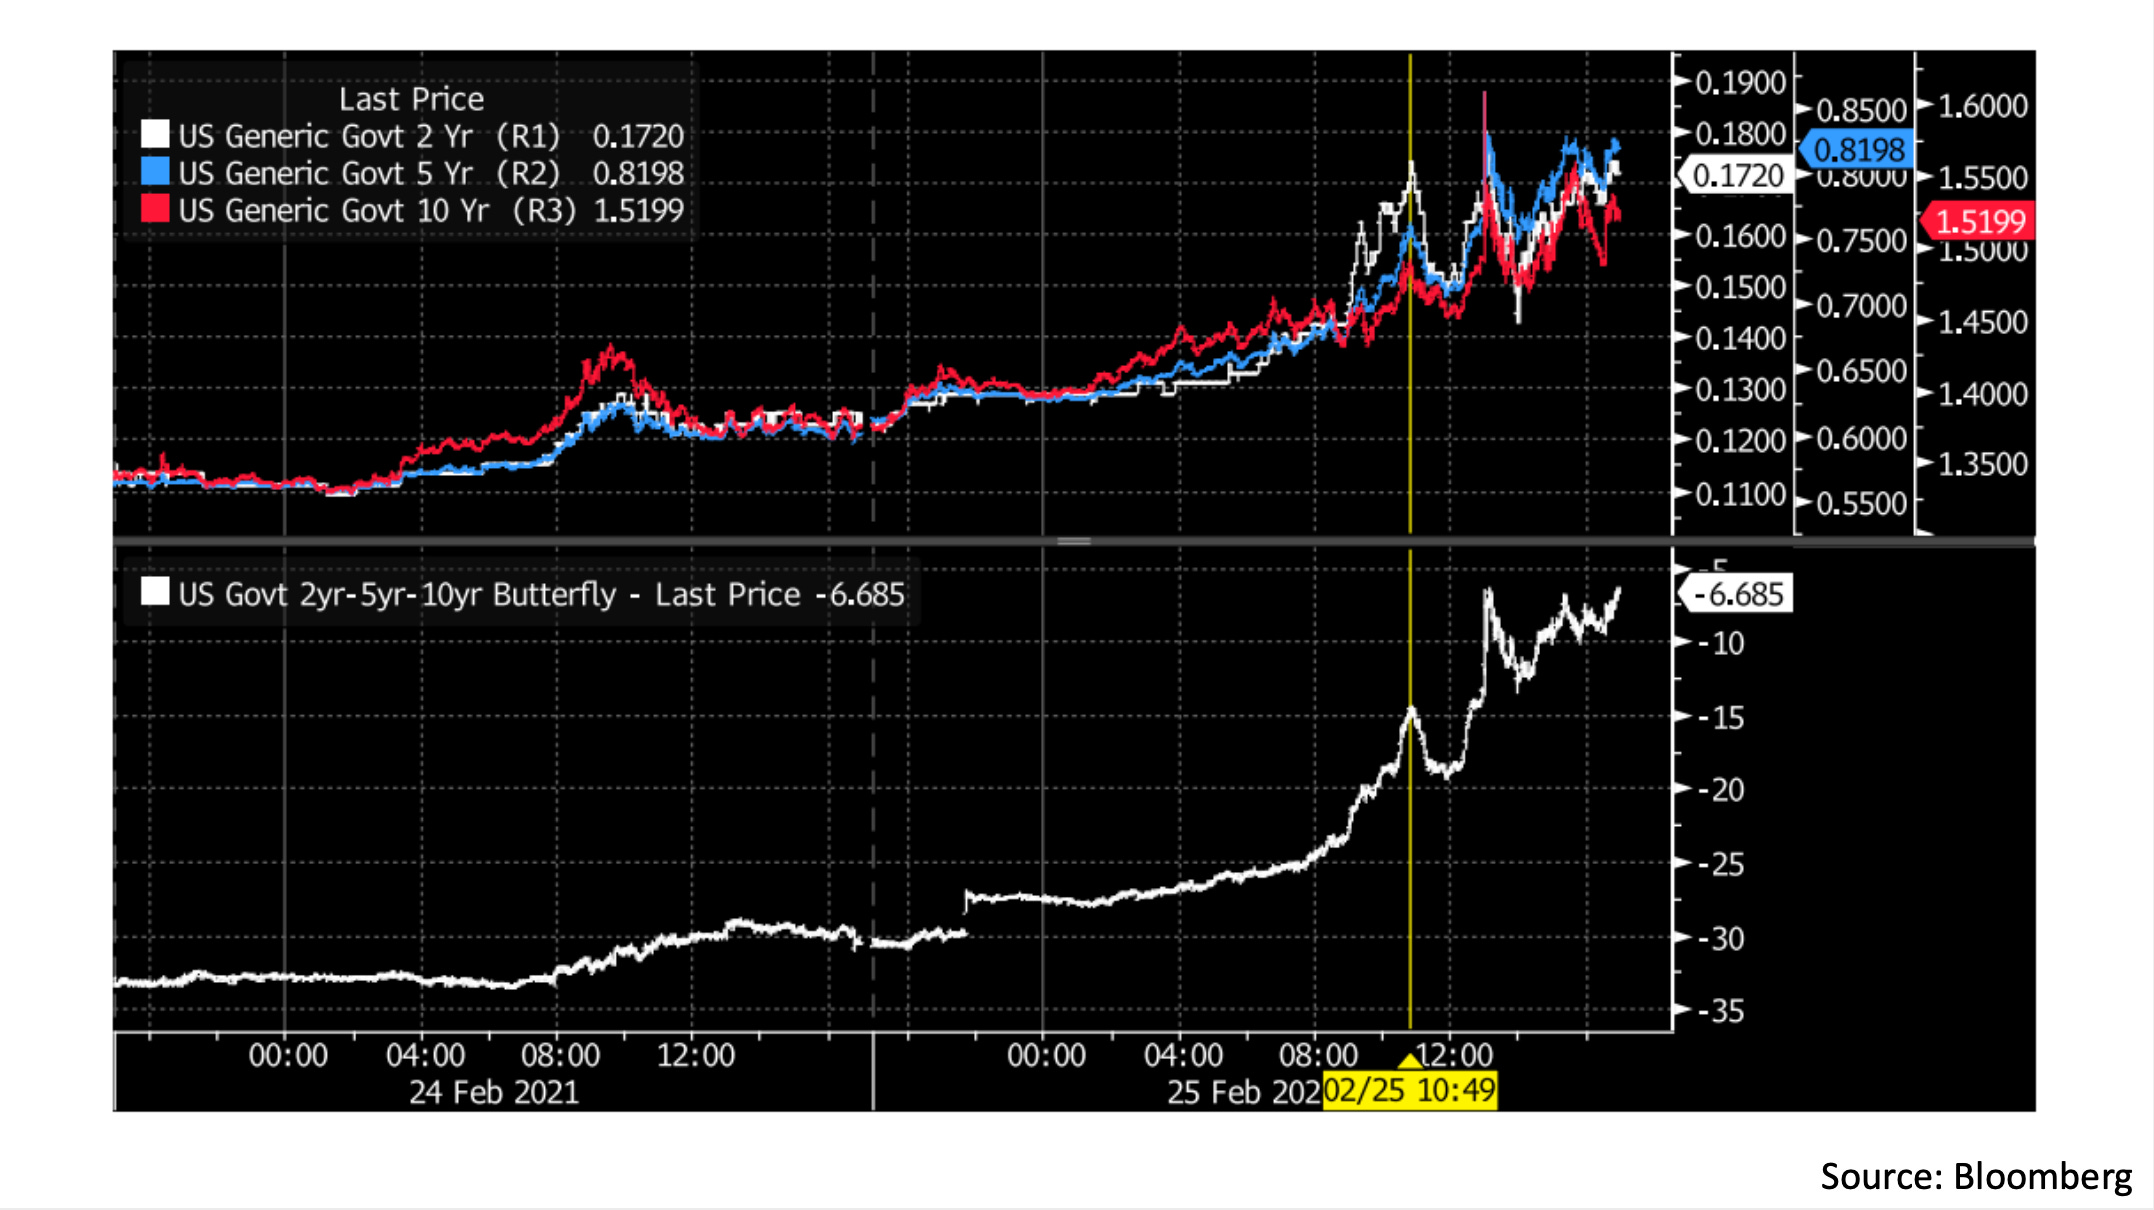
In this last chart, we see the action in 2 year, 5 year, and 10 year Treasury bond yields on that day in the top panel, with the time of the burst in swaption volume marked by the yellow line. The bottom panel shows a proxy for a position short the 5 year maturity while long the 2 year and 30 year maturities, which was also extremely volatile on that day. From this chart we see that immediately after the large swaption trades hit the tape in the morning, the bond sell-off actually reversed briefly and the relative value position in the bottom panel also lost some momentum, before the chaos returned after the weak 7 year Treasury auction around 1pm. This also suggests some hedges were put on that temporarily alleviated overall selling and pressure on traders caught on the wrong side of relative value trades. While the flash crash that was the highlight of the day was likely more closely related to bids being pulled from the market after the 7 year auction, we can see from this data that high derivatives volume also seems to have an effect on trading in the bond market.
Some more detailed analysis of this data might be coming in later Chartbooks, but I cannot include any more charts without going over the email length limit here so that will be all for this week. As always, thanks for reading if you made it all the way here and hope to see you back next week for another Chartbook :)
Cheers,
DC
Thanks for the insightful commentary. It would be highly useful to have a follow up write up on the detailed analysis of the DTCC data (and other sources). I am particularly interested in how vega hedging for structured rates book are linked, in addition to this delta/vega linkage.