Chartbook #16
June 26, 2022
Hello everyone and welcome back! This Chartbook will take a slightly broader view than usual at the evolution of US banking and money markets over the last 20 years or so. The first section will look at how regulations and events since 2008 have changed banks from the primary money market arbitrageurs to more conservative institutions that participate in money markets mostly opportunistically. Next we will turn to the Treasury repo market, its participants, and their role in the setting the new benchmarks of US dollar interest rates. Finally, the last section will introduce “Eurodollar 2.0” as a fundamental evolution in the global money markets and look at some scenarios for how the new system may fully mature. Okay, now let’s get started!
The New Banking System
From the start of the Eurodollar system through the late-2000s, interbank markets served as the gold-plated reference for US money market rates around the world. The rates at which banks could borrow unsecured funds onshore or offshore (the Federal Funds or Libor rates, respectively) were set on strong volume and were held as the benchmarks for a huge range of derivatives and peripheral markets. The role of the Fed in this system was to control the overnight Fed Funds rate by supplying or removing small quantities of reserves in regular open market operations, and to provide a backstop through the discount window if an acute crisis threatened the stability of the onshore interbank market.
Since banks in this period had relatively low liquidity and capital requirements, they could expand their balance sheets as necessary to transmit policy rates to all kinds of private money markets. Through the London interbank market and an array of offshore and onshore investment vehicles, the banks of the time arbitraged spreads in Libor, commercial paper, FX swaps, and other rates, keeping them at tight spreads to policy rate targets. This led to a banking system with heavy interbank borrowing, low levels of safe assets, and high gross leverage, which peaked in the lead up to the financial crisis and has reversed dramatically since then.
In the fallout of the 2008 crisis, a new framework of bank regulation meant that unsecured interbank borrowing was discouraged and higher levels of safe assets and capital mandated by new rules. Money market fund reform also curtailed the extent to which these vehicles could invest outside of the government securities space, which restricted their activity in riskier private sector money markets. Finally, the high fiscal spending and government debt issuance of the last two years has added more Treasury securities to bank asset portfolios and grown the balances of retail and corporate depositors significantly. These changes have created a banking system is very different from the system of the pre-crisis era, as we can see from the next few charts, starting with the overall balance sheet composition.
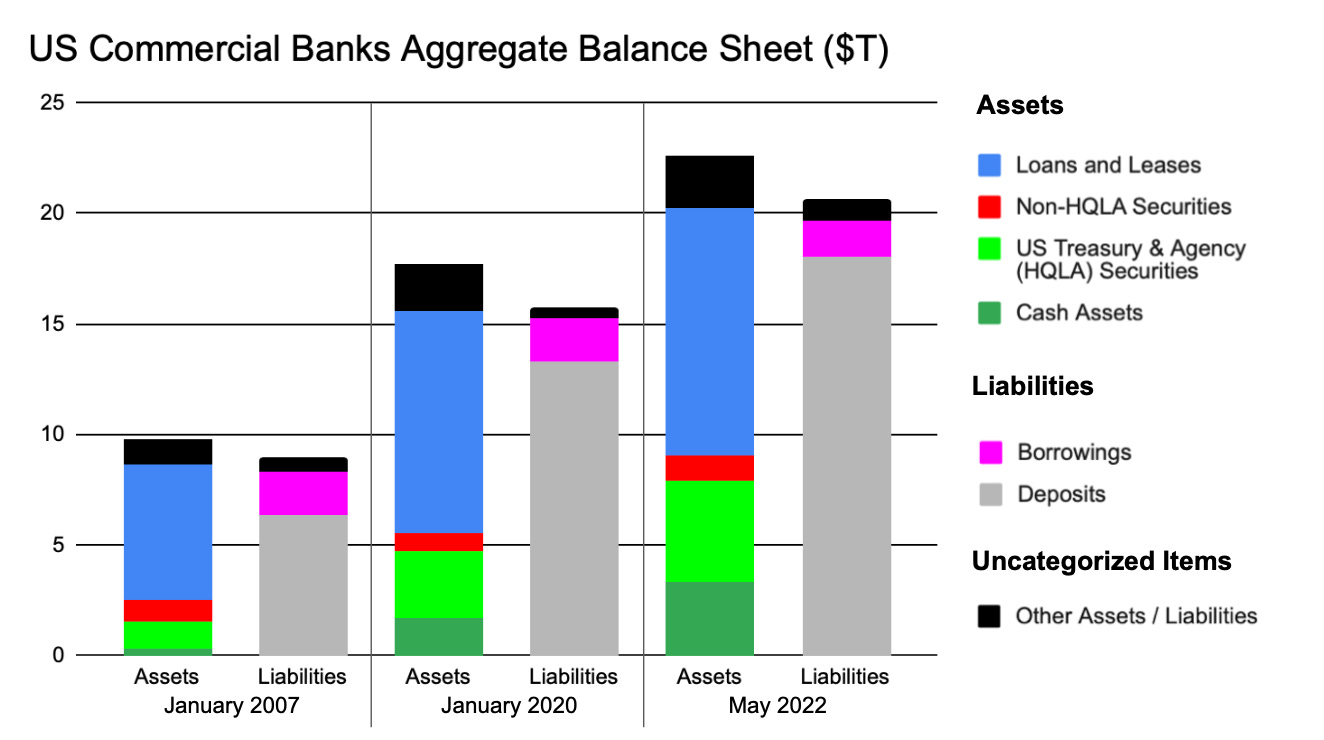
The chart above shows the major categories of commercial bank assets and liabilities at the start of 2007, the start of 2020, and today, as reported in the Fed’s H.8 data. Starting on the asset side, the dark green bars represent both physical cash held in bank vaults and reserves at the Fed, which can be converted into physical cash as necessary. The lighter green bars are high-quality liquid securities (HQLA securities), such as US Treasuries or mortgage-backed securities issued by the government sponsored enterprises. These securities are generally free of credit risk and are regarded as a reliable source of liquidity by bank regulators. The red bars are investment securities with no government credit support, such as corporate bonds and private sector asset-backed securities. These are riskier and less liquid than HQLA securities, and though they once made up a significant portion of bank’s total securities portfolio, growth in safer assets has made them less relevant to the overall mix. The blue bars are loans and leases, products of the core lending business providing credit to individuals and companies in the real economy. On the liabilities side, banks are funded by deposits (shown in grey) and money market borrowing (shown in pink). Both sides of the balance sheet also have various miscellaneous items, like longer-term debt, trading-related items, physical bank branches and offices, that are not broken out in this chart and shown as the black bars at the top.
Since 2007, the clearest trend has been the growth of cash and HQLA assets from less than $2T to over $8T today. A key driver here has been the post-crisis Liquidity Coverage Ratio (LCR) rule, which requires that banks hold sufficient liquid assets to cover all expected outflows for a 30 day stress period without tapping the money markets for additional funding. Since the LCR stress scenario assumes some portion of deposits end up as outflows (ranging from 3% for FDIC-insured retail deposits to up to 100% for deposits from hedge funds and financial firms), it has replaced the pre-crisis concept of reserve requirements in ensuring that banks can endure a depositor run. A further consequence of the LCR rule is that any money market funding at less than 30 day term must be repaid and cannot be rolled over in the stress scenario, making it unattractive for banks to use this kind of funding. On the other hand, due to their low outflow rates in the LCR calculation, insured retail deposits have become the most favorable form of bank liability.
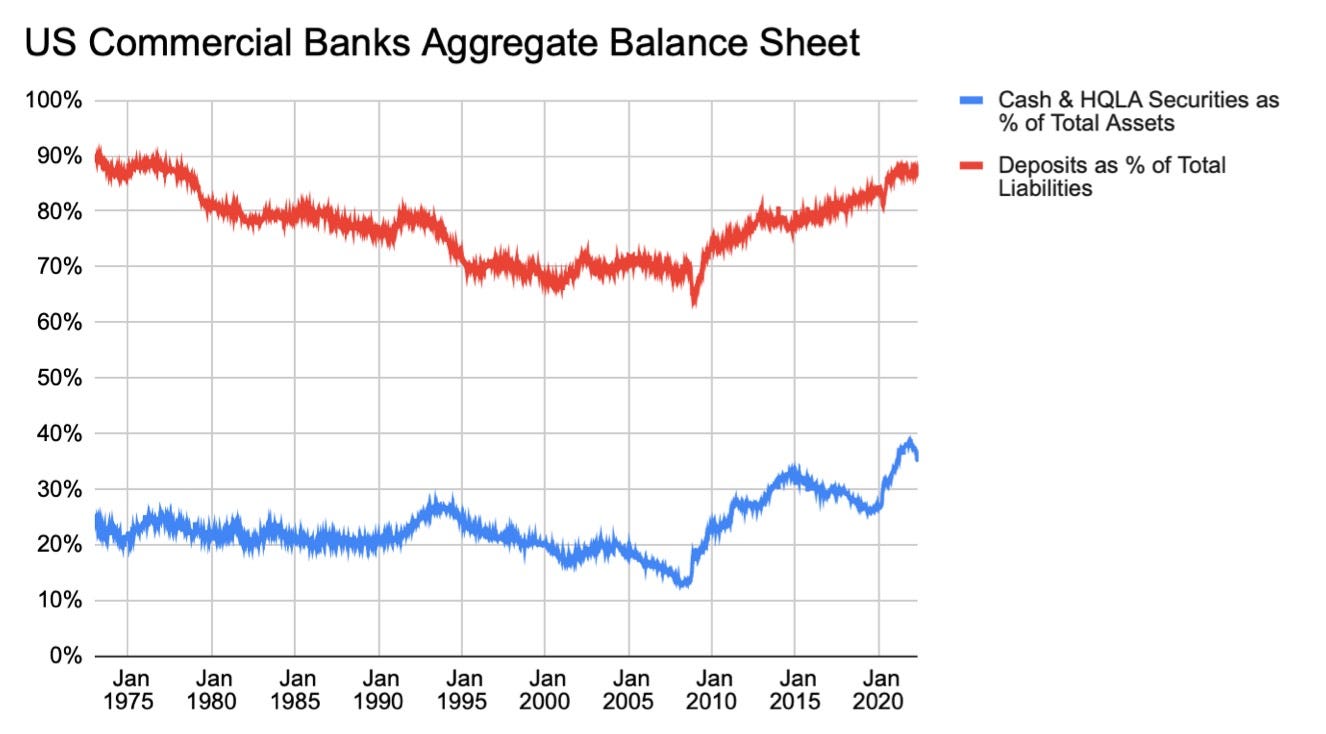
On a longer term chart, these changes can be seen as a trend shift in the regime of the previous 30 years. Prior to the financial crisis, banks had been gradually shifting their liabilities away from deposits and their assets away from HQLA for decades. By 2008, only about 15% of US bank assets were free of credit risk, and almost 35% of liabilities were instruments other than conventional deposits. The breakdown of the interbank markets and resulting liquidity regulations marked the end of this, with deposits returning to almost 90% of bank liabilities and HQLA share of assets more than doubling over the last 15 years.
Besides liquidity rules, the other key pillar of post-crisis financial reform has been capital requirements. In the context of bank regulation, capital refers to the degree to which bank assets exceed their liabilities, allowing banks to absorb losses on their riskier assets. Though the H.8 survey does not explicitly ask about capital levels, the difference in the totals on each side of the balance sheet in the first chart provides a rough sense of it. For the largest banks in the current system, assets on the balance sheet require capital on both a risk-weighted and absolute basis. The latter rule, called the Supplementary Leverage Ratio (SLR), means that past a certain point banks must retain more earnings or issue more equity to grow the balance sheet regardless of how safe their assets are. Though cash and HQLA securities were temporarily exempted from this calculation for about a year in 2020 and 2021, the SLR rule has often been the binding constraint determining the size of large US bank balance sheets. This has been especially important recently as fiscal and monetary policy have added to balance sheets very broadly, driving banks to discourage less favorable non-retail deposits and leading to growth in money market fund assets and by extension the Fed’s reverse repo facility.
The overarching theme of the new banking system is that banks are now primarily deposit-taking institutions, not major money market borrowers. Due to the need to be able to withstand a month-long funding drought, relying on the interbank market for liquidity has become impractical, and holding it outright has become the new normal. Liquidity and size constraints have transformed banks from highly-leveraged funding arbitrageurs to mainly opportunistic participants in secured overnight markets such as repo. With the ongoing phase-out of Libor and the decline in volumes of the Fed Funds market, this means the setting of short-term interest rates has now shifted to Treasury market dealers, relative value hedge funds, and money market funds, so let’s turn to these in the next section.
The New Money Market
The most profound change in US dollar money markets since the pre-crisis Eurodollar system is the move from unsecured Fed Funds and Libor to risk-free rates as the accepted reference curves. In the new system, the risk-free benchmarks are provided by the Treasury and repo-indexed swaps curves, as shown in the chart below.
Since the repo and Treasury markets are deeply connected, let’s first look at the relationship between these two curves in theory, and then move on to the real market participants involved. In a hypothetical scenario, imagine you want to borrow in repo to buy Treasuries because you think it can provide an attractive leveraged yield. So you borrow in overnight repo market at the current SOFR rate of about 1.5% to fund a 10 year Treasury yielding around 3.15%, with the intent of rolling the trade every day and earning the spread between the two rates. This naive approach has a problem, however, in that repo rates and the market value of Treasuries fluctuate significantly over the period it would take to realize that yield. Without some insurance against fluctuating rates, this trade would have a significant chance of turning bad due to the mismatch in duration between your assets and liabilities. A logical hedge would be to swap your floating rate repo liability into a fixed rate liability for the duration of the trade, which is exactly what the interest rate swaps market is built to do. If you hedged by swapping 10 years of SOFR payments to a 3.0% fixed rate, the remaining spread can be directly arbitraged by holding the Treasury to maturity. This would not be completely risk-free of course, but provided you are able to roll the position daily and maintain enough margin to absorb mark-to-market changes you would be earning a positive carry on the rate differential. Though real world relative value trading is much more complex, the example highlights how transmission of overnight rates and forward expectations into the broader system is now the job of leveraged arbitrageurs in Treasury, derivatives and repo markets. At the foundation of all this is the Treasury repo market, where the SOFR reference rate is set and a wide range of arbitrage transactions are financed, so let’s turn there next!
The map shows the major participants in the Treasury repo market and the two main service providers: BNY Mellon as tri-party agent and DTCC Government Securities Division as a clearing platform for dealers and sponsored members. Since the dealers are active in all segments of the market, let’s start with their role first. The core of the dealer business model is creating a matched book by borrowing from cash lenders at slightly lower rates than you offer to customers or other dealers. The cash lenders in this case mainly come in through the tri-party market, where BNY Mellon provides custody and monitoring of the collateral and manages payments between the borrower and lender’s deposit accounts. The services of a tri-party agent make it easier for institutions like money market funds, bank portfolios, corporate treasuries, and even the Fed to manage the operational details of being in the repo market and lending their cash. A portion of the tri-party market is also cleared, meaning that in addition to the custody and payment services provided by BNY Mellon, the trade is also netted against other cleared trades the dealer makes through DTCC Government Securities Division. The netting offered by central clearing is an efficiency for the dealer community, as they only need to settle the residual position in their cleared book as opposed to the gross value of every single trade. This benefit has led many dealer-based markets to establish cooperatively managed clearinghouses in the past and the Treasury market is well suited for this at scale.
Next let’s look at the interdealer markets, which are split into the General Collateral Financing (GCF) and bilateral segments. Both of these markets are cleared, but GCF also uses the tri-party services of BNY Mellon and operates only in general collateral. Trades in the GCF market do not specify what securities are to be used in the transactions (any “generic” Treasury is acceptable) so it serves as a convenient way to source cash quickly from other dealers. The interdealer bilateral market, on the other hand, does not use a tri-party agent and trades on specific collateral. Dealers in this market make their own arrangements for collateral and payment management, and may quote a different rate depending on how in-demand the specific security being used as collateral is. The bilateral cleared market is much larger in volume than GCF, as it allows dealers to efficiently redistribute not only cash, but also the Treasury inventory they need to make markets for their customers.
Finally, let’s turn to the customers, who are divided into two broad groups depending on their access to central clearing. Customers without the ability to do cleared trades participate in the uncleared bilateral market, which is fairly opaque and works mostly through ad hoc arrangements with the dealers (an over-the-counter market). For customers that trade very actively in repo, such as hedge funds specializing in arbitrage, DTCC offers a Sponsored model where the dealers can onboard the customer to the clearing platform and provide the benefits of netting. Last September, Sponsored customers were also given access to the GCF market through the Sponsored General Collateral Service (not shown in the map), but there is not much public data on this segment and it is probably still immaterial to the broader functioning of the market. With this background on the structure, we can look at volumes from a few segments of the market that report data and try to observe some of the historical shifts.
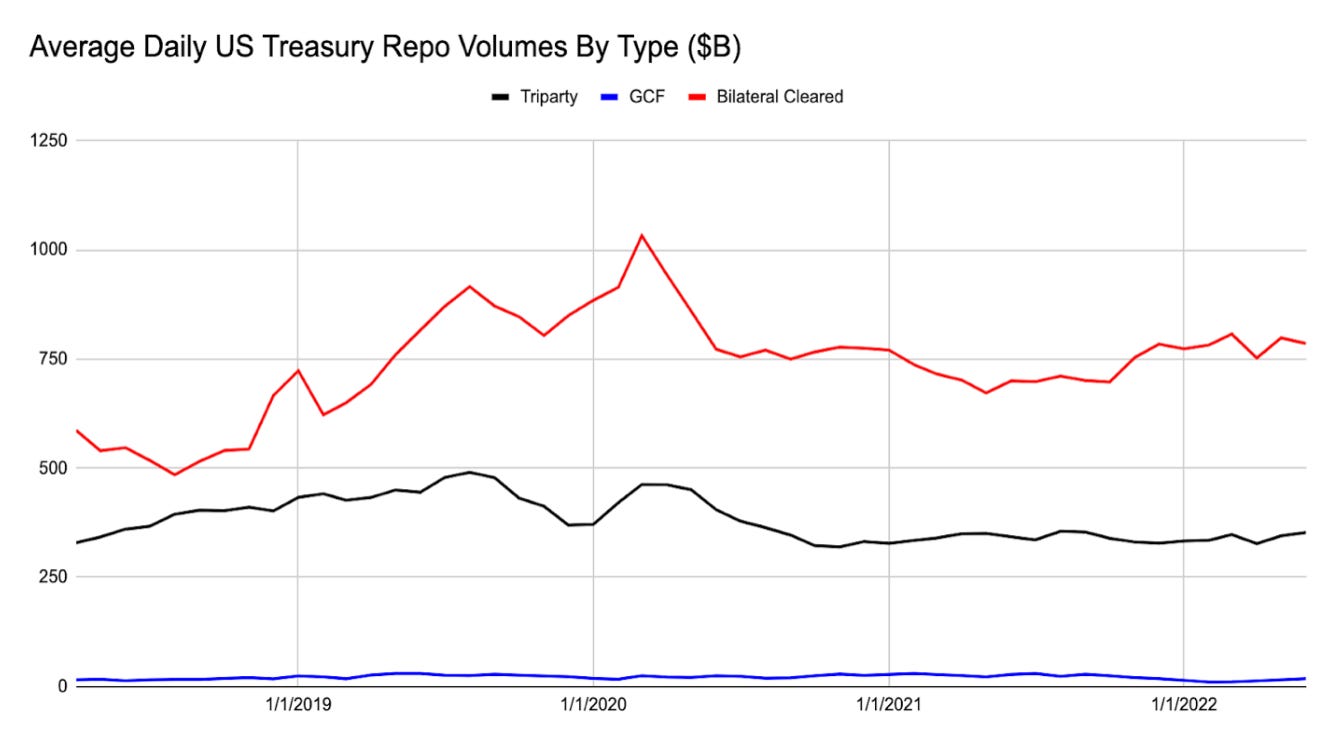
While it is very difficult to collect reliable data on the fragmented over-the-counter market, trades that use the services of BNY Mellon or DTCC are reported to regulators and some statistics are published. The red line in the chart above shows the average daily volume of bilateral repos cleared by DTCC, including both interdealer and Sponsored trades. From about mid-2018 through early-2020, there was a marked uptrend in cleared bilateral activity as dealers and their Sponsored customers redistributed larger volumes of securities among themselves. After the market turmoil of March 2020, however, bilateral cleared volumes fell sharply and then dropped further in early-2021, before rebounding a bit in the most recent 12 months.
Tri-party repo volumes, shown by the black line, also rose in the first half of the available data window and then dropped off. It should be noted here though that the tri-party data series does not include trades involving the Fed, which reached up to $100B a day in volume during the time the Fed intervened significantly in the repo markets between September 2019 and June 2020. As a result, there is some “crowding out” effect reflected in the chart during the months the Fed was adding liquidity. Also omitted from this series is the reverse repo facility, where the Fed acts as a borrower in the tri-party repo market to absorb excess cash not needed by dealers. Since demand from dealers has stayed fairly flat over the past two years, most of the marginal cash entering the tri-party market from growth in money market fund AUM has gone to the Fed, driving the facility to its current size of over $2T.
Finally, the blue line on the chart shows average daily volumes in the GCF market. Though GCF is probably the most extensively reported repo service and the participants are all well-known firms, it is not large in absolute size as most dealers would rather source cash from tri-party cash pools than other dealers. On the margin, however, GCF plays a small but important role in ensuring that cash is redistributed in the interdealer market as frictionlessly as possible if needed. With some extra filtering, the pricing data for trades in these three segments is used to calculate SOFR, the new reference rate for a broad range of derivative and loan contracts.
To look a bit further into the dynamics of the bilateral cleared segment, we can split the interdealer trades from those that involved a Sponsored member, as shown in the chart above. Prior to mid-2019, the volume of Sponsored trades was not published by DTCC, but we can see from the available data that they have been a material fraction of overall volume for at least the past 3 years. As the Sponsored community was largely responsible for the rise and fall of volumes around March 2020, this suggests that arbitrage hedge funds grew rapidly in the lead up and then suffered severe losses in that market panic, as indeed was the case. Since then, Sponsored volumes had been largely flat and down about 50% from peak until recent months, when some signs of a revival started to appear. This brings us back to the present day, where this new system of interest rate benchmarks is set to be tested by some of the most extreme policy and macroeconomic conditions seen in decades. In the final section, let’s look at how the tightening monetary policy is set to change things, and lay out some possible scenarios for what may happen soon.
Eurodollar 2.0
As the Fed begins to shrink its balance sheet this summer, it will allow Treasury securities in its portfolio to mature without reinvesting the proceeds, effectively cancelling out cash used to pay down the principal from its balance sheet. To keep servicing its funding needs, the Treasury will issue more debt to the private market than it would had the Fed kept its holdings unchanged. Depending on how the newly issued debt is distributed, this will draw different forms of cash from the private markets to replenish Treasury accounts.
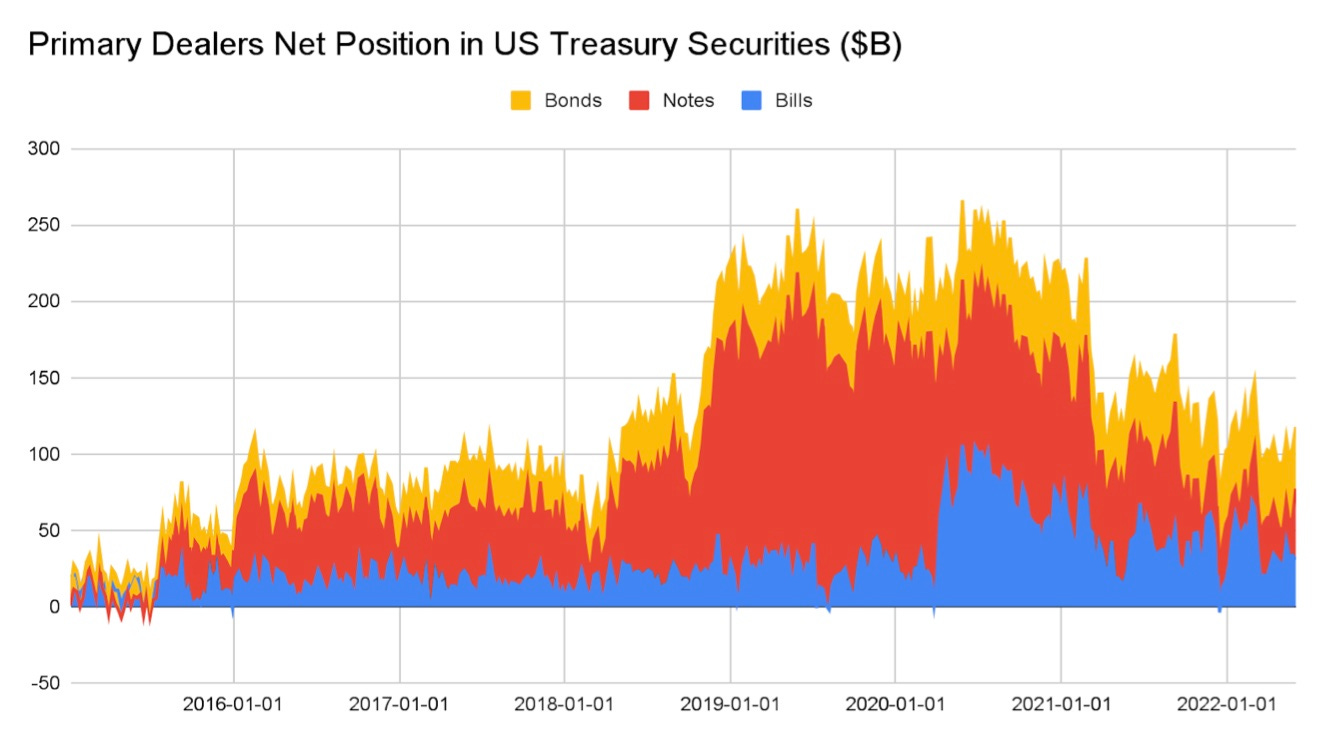
We can observe this dynamic by looking at a breakdown of the liabilities side of the Fed’s balance sheet, which is now just beginning its descent from the all time high of about $9T set earlier this year. On the chart, the liabilities are broken down into five categories as physical cash, bank reserves, reverse repos with foreign central banks and money market funds, Treasury balances, and other items such as swap line balances and minor miscellaneous accounts. The most straightforward progression of QT from here would be if private investors simply use bank deposits or money market fund balances to purchase more Treasury issuance, shrinking bank reserves or reverse repos respectively on the Fed’s balance sheet. But what happens if private investors do not show up? Dealers would still be required to take down the full size of Treasury auctions but without end customer demand, their inventory will begin to pile up. To understand how the new system will deal with this, let’s look at some historical data on the inventories of the primary dealers, which are the largest firms designated as responsible for managing the resale of US Treasury auctions.
Here we see that up to about the start of 2018, dealers held relatively modest inventories of Treasury debt, ranging from about zero to $100B total across bills, notes and bonds. Once the last cycle of QT began in 2018, dealers started to accumulate inventory, especially in the 2 year to 10 year maturity range shown here as Notes. As Sponsored repo volume picked up through 2019, dealer inventories stabilized, suggesting that arbitrage funds were taking some pressure off dealers in absorbing the ongoing issuance. Then in March 2020, the Fed started buying notes and bonds very quickly and the Treasury issued a flood of bills, which shifted the composition of dealer inventories towards shorter duration. Over the next two years, dealers slowly unwound their inventory and returned to about pre-2018 level just as QT is about to begin again. So will dealer inventories pick up again now that the Fed is entering another cycle of shrinking its balance sheet? They have not yet, but the Fed is expected to reduce Treasury holdings at a pace of $60B per month for some time and the Treasury will continue adding to the amount outstanding throughout this period. Should end customers not step in to bid on the new supply, Treasuries will cheapen relative to forward policy rate expectations, giving dealers and arbitrage funds an incentive to fund Treasury purchases in repo and leading to a growth in repo volumes.
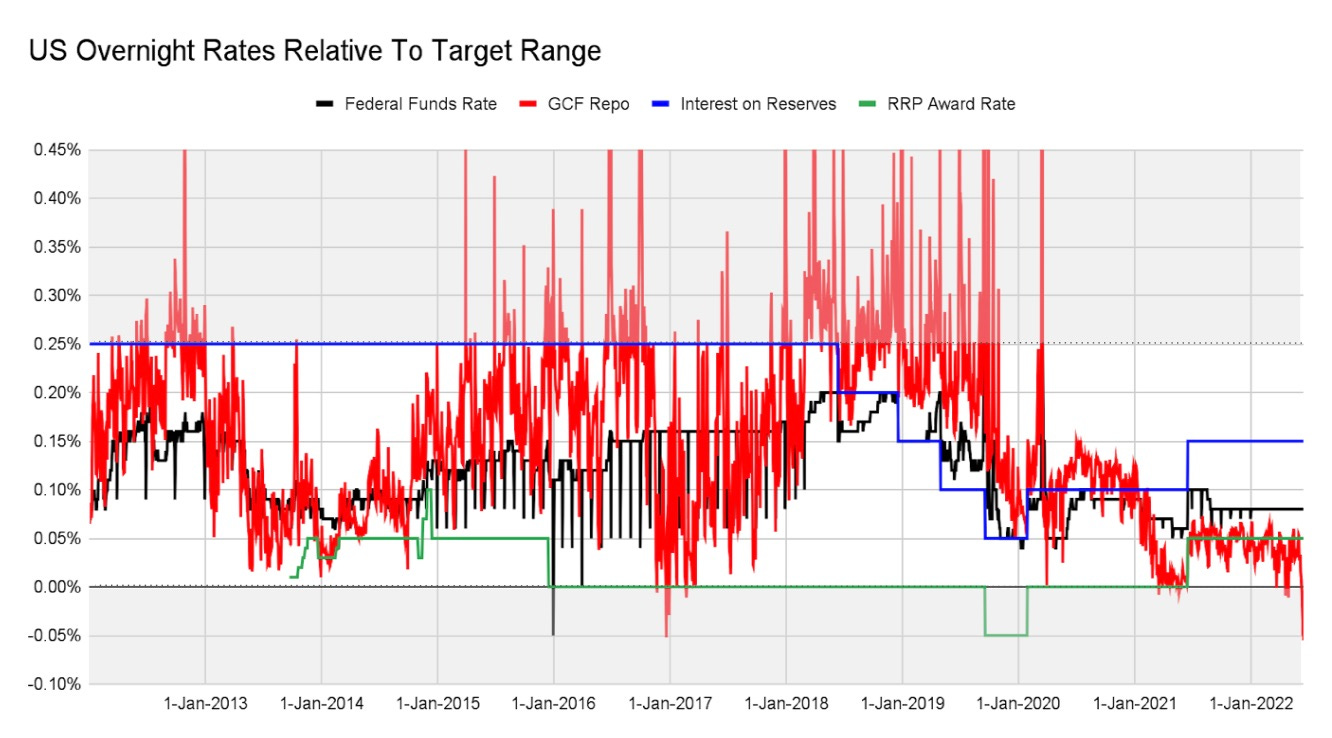
But what would happen to overnight rates in this scenario? If the demand for cash in the repo market increases, the first marginal source of supply would be tri-party lenders shifting from the Fed’s reverse repo facility to normal tri-party repos with the dealers. This would require dealer rates sustainedly exceed the Fed’s offered rate to gradually draw money market funds back into the private sector market. Beyond the immediate buffer of the reverse repo facility things get more interesting, so let’s have a look at how overnight rates have moved historically relative to the policy range and what might be different now.
In this chart all the rates have been normalized to remove the effects of policy rate moves. Though there were many changes to the Fed’s target range in this time period, the lower bound is always at zero and the upper bound is always at 0.25% here. The blue and green lines show the rates offered on bank reserves and reverse repos, respectively, which serve as the Fed’s main tools in controlling how overnight rates trade in the range. The black line shows the market Fed Funds rate and the red line shows the rate on GCF Treasury repos. Since for much of this period the interdealer market did not have access to Fed backstops, repo rates have been fairly volatile in the past and frequently strayed out of the range. During 2018 and 2019, as demand for repo funding was high, GCF repo traded persistently above the Fed’s administered rates, presenting an opportunity for money market lenders. While there was little cash in the reverse repo facility at this time, banks had some excess reserves and did their part when possible to provide funding to cash-hungry dealers and arbitrage funds. In an earnings call at the time, JPMorgan Chase CEO Jamie Dimon summed up the bank’s opportunistic approach to money market lending:
We have a checking account at the Fed with a certain amount of cash in it. Last year, we had more cash than we needed for regulatory requirements. So repo rates went up, we went with the checking account which paid IOER into repo. Obviously makes sense, you make more money.
- Jamie Dimon on JPM Q3 2019 Earnings Call
Today, repo rates are straying in the opposite direction, falling below the lower bound significantly as the Fed has raised the target range higher. This lagging effect in repo will probably stick around until the policy rates reach their terminal level, as repos compete in money market portfolios with other lagging instruments such as bank deposits and it takes some time for things to rebalance to the new level of interest rates. In the longer term though, the pressure will be on repo rates to rise within the range again, especially if repo market participants end up absorbing a large share of the Fed’s balance sheet rolloff. If this occurs and cash from the Fed’s reverse repos is mostly drawn back into the private markets, we may reach a point where banks can once again become opportunistic lenders at times when repo rates exceed their interest on reserves. In this scenario, it is even possible that repo rates would start pricing year-end effects in bank lending, making it possible to hedge calendar turns in SOFR products similarly to how it is done now in Libor-indexed derivatives.
It seems unlikely, however, that we see a repeat the 2019 repo spike. Back then repo rates jumped several full percentage points on a day when banks saw a significant outflow of cash to the Treasury and could not step in to the tri-party market to meet the demand from dealers. In this new cycle, besides the money market funds and banks, the Fed is also willing to backstop the repo market directly through the Standing Repo Facility. With an explicit lender-of-last-resort, it would be difficult for a funding squeeze to escalating like it did in 2019, even if the current large pool of marginal private cash lenders slowly dwindles over time. With the right tail risk in repo rates cut off, money markets can now develop around the system of risk-free benchmarks discussed earlier.
Where unsecured markets dominated in the past, the reference rates in a Eurodollar 2.0 world are set onshore by dealers and arbitrageurs in secured markets with explicit policy backstops and highly centralized clearing and custody. By creating a full rates curve using HQLA securities and nearly frictionless netting, the Treasury repo market has completely overhauled how the price of money is set. The move from interbank loans to interdealer repos at the center of the global money market has not happened in a day. Over the course of 15 years, the drive to make banks safer and the repo market more stable and efficient have gotten us to the point where the outline of the new game is now clearly coming into view. Looking closely at the mechanics and the roles of cash lenders, dealers, and customers, we can try to map out the path to a fully mature Eurodollar 2.0 system. As the Fed’s tightening cycle comes into full force, there will undoubtedly be issues and the whole structure will be stress tested, but when we do arrive at a new normal it will be very different from 2018 or 2007 or any other time in the past.
That is all for now! When the next Chartbook comes out, it will probably return to more detailed looks at specific market events. Hope you enjoyed this one if you made it all the way here and as always thanks for reading :)
Cheers,
DC






Your posts are always a fantastic lesson. Thanks DC for doing this! Learned a ton.
Made tons of notes, Thank you