Chartbook #15
March 13, 2022
Hello everyone and welcome back! This Chartbook will be looking at the last few weeks of stress in USD money markets. As markets have moved quickly recently, it has been hard to write any commentary that stays current for more than a few days at most. In the interest of publishing this while it is reasonably up-to-date, there will be slightly fewer charts this time and I will try to keep the commentary brief. Okay, let’s get to it!
To begin, let’s have a look at the overnight repo market, the shortest tenor of USD funding in money markets. The repo market currently has effectively three backstops to draw additional funding from in a stressed situation. Firstly, there is about $1.5T of money market fund assets earning 0.05% at the Fed’s reverse repo facility (white line). As repo rates rise above 0.05%, money market funds can withdraw cash from Fed repos and redeploy it into the private sector repo market, providing the first backstop. If repo rates continued to rise higher to over 0.15%, banks would begin to deploy their excess reserves, which would serve as a second backstop at the orange line. Finally, not shown on the chart, the Fed has made funding available above 0.25% through the Standing Repo Facility as the third backstop. So far, the overnight funding market has been calm, with repos secured by generic government collateral (red and green lines) trading within their normal ranges and rates on specific collateral (purple) showing no signs of strains in funding specific bonds.
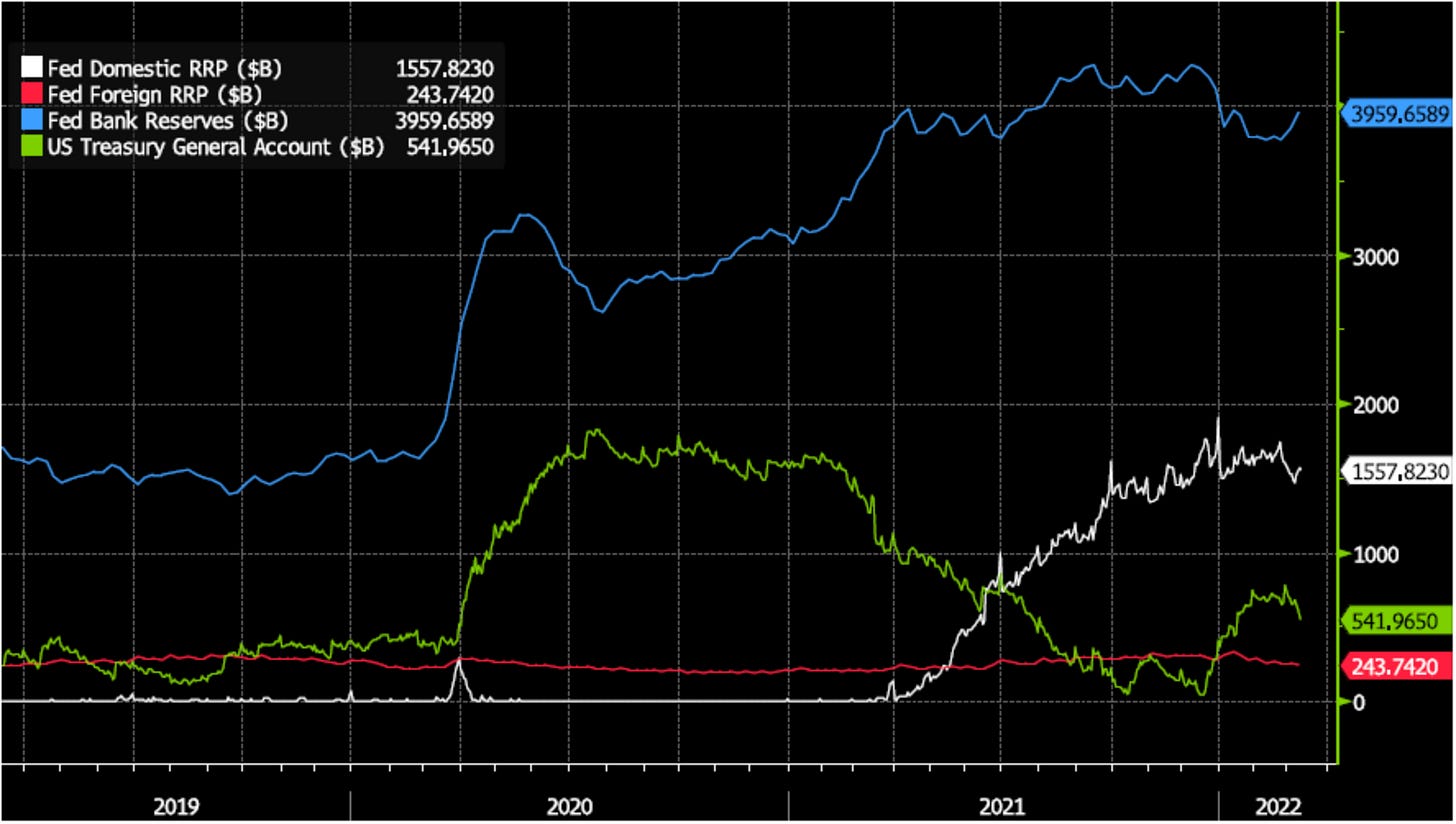
On the cash side of the repo market, the Fed’s balance sheet has finally stopped growing as of early-March, as the last of QE purchases were completed. As of the end of QE, cash balances of US banks held with the Fed stand at around $4T (blue line), and money market funds hold about $1.5T of cash in the reverse repo facility (white line). This is in sharp contrast to episodes of repo stress in 2019 where money market funds had almost no cash with the central bank, and bank reserves were only about $1.5T total. In the current environment there is much more cash on the sidelines waiting to enter the repo market, which will provide backstops if rates move higher due to stress. Since the Fed’s balance sheet has stopped growing due to the end of QE and is not expected to start shrinking for a few months at least, changes in liabilities on the Fed’s balance sheet must offset each other in the near term. Recently, the biggest factor in this rebalancing has been the Treasury’s cash balance, which had to be replenished after falling almost to zero during the debt ceiling gridlock late last year. As the Treasury raised about $500B in cash (green line), it drained some from bank reserves and money market funds, notably without much disruption in repo rates. Rebalancing of Fed liabilities will become more important if QT comes into focus this summer, but for now it seems we can expect levels of bank reserves and reverse repos to stay slightly below all time highs and no shortage of cash in the secured overnight market.
Now looking at term markets, we have seen the rates on Treasury Bills (white line) and overnight indexed swaps (red and blue) rise at the 3 month point in anticipation of an imminent increase in Fed policy rates. There is, however, a significant divergence here in unsecured rates such as Libor and commercial paper (green, orange, and purple), which have risen much higher. This kind of divergence is usually indicative of stress, as Libor and commercial paper rates involve a credit component, and there is definitely some of that in play here, but in this case the spread is also further widened by aversion from typical commercial paper buyers. Money market funds usually active in this market have been holding back due to the risk of taking mark-to-market losses on 3 month investments. Since money market funds must offer daily redemptions to their investors, taking even small even brief market losses is highly frowned upon, driving managers toward the overnight space and away from commercial paper. This hesitancy from money market funds to step in to the term market, combined with general uncertainty around global stability and the near term levels of policy rates, has led to a greater concession in yield from issuers of commercial paper and widened spreads to 30-40 basis points vs OIS.
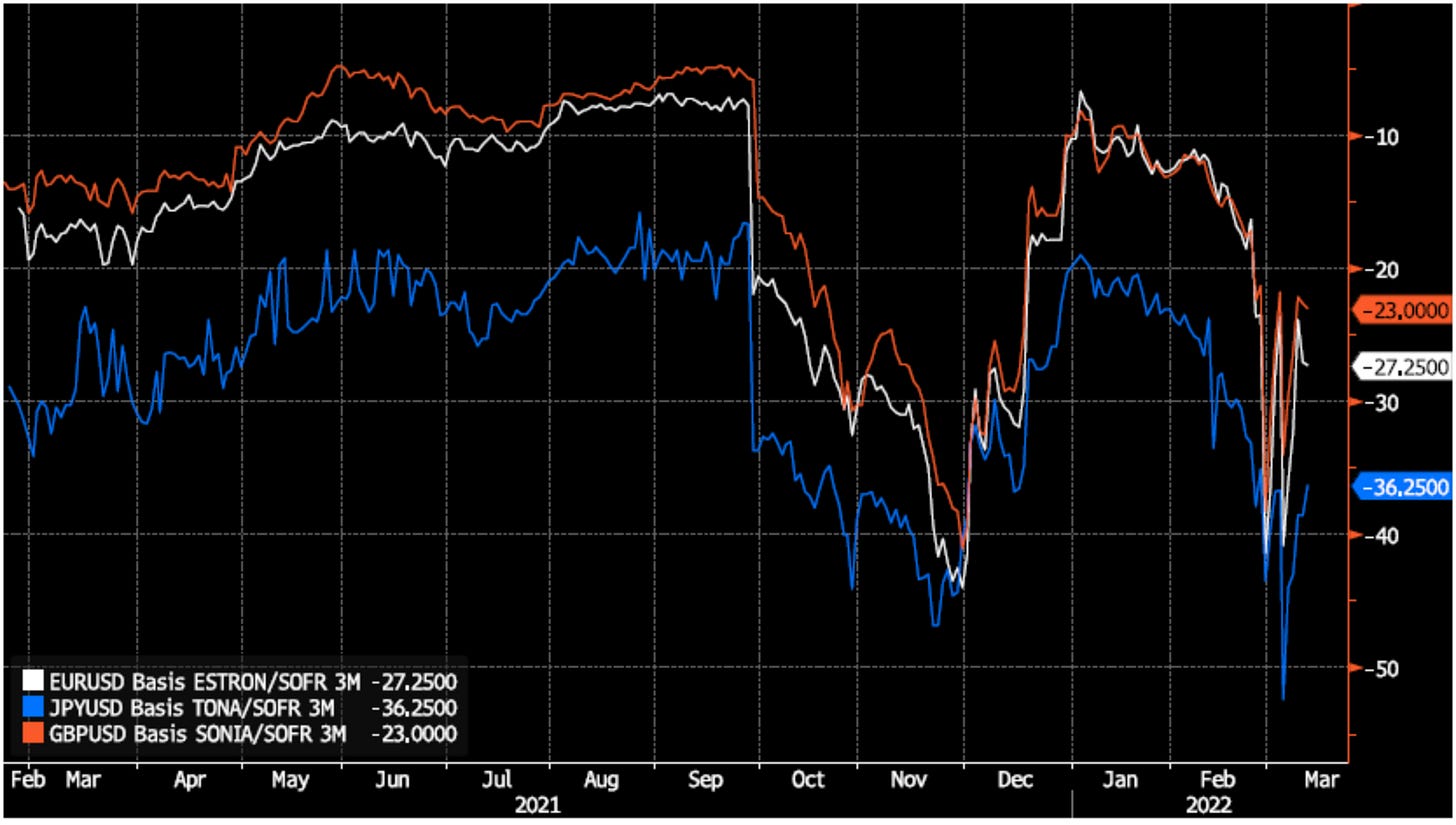
Spreads have also widened in the FX swaps markets, with the premium to borrow US dollars widening about 10-15 basis points against most major currencies from January levels. Like the move in commercial paper yields, this move may seem alarming at first, but it is coming off a base of extremely low premiums in these markets over most of the past 2 years. During periods of tighter monetary policy, and even recently around year-ends, commercial paper and FX swaps frequently traded at these spreads. Unsecured and cross currency markets get funding at the margin of US dollar markets and as they were the last to compress as all other rates were near-zero during the 2021, they are also first to decompress as a hint of risk returns to money markets. To put the decompression into perspective, we can note that Fed swap lines and repos with foreign central banks have yet to show any material increase, and are even below year-end levels for the past few years. If there were a severe crisis in FX swap markets, global banks would reach out to their local central banks for USD funding, which would be provided by the Fed through these standing facilities, but to date this has not occurred.
Looking forward at funding spreads in the swaps (FRA-OIS) and futures (SOFR vs Eurodollar) markets, we see the strongest dislocation in the spot (white) and March (red and orange) spreads. June spreads (green and yellow) have also widened, though a few basis points less. In the September contracts (blue and purple), the spread being priced is barely wider than what it was in early-January, suggesting that the funding premium is expected to dissipate by then. Also notably, these spreads have stabilized over the past week, not making new highs after the gap-up open on March 7. These are encouraging signs that the stress in money markets is for now mostly contained and not an imminent risk to financial stability. But what about markets that have been more severely disrupted spilling over into money markets?
So far, the most acute impacts of the crisis have been felt in commodity markets, where the prices of energy, agricultural commodities, and some metals have experienced their largest moves in many years. Some commodity trading houses like Trafigura and Gunvor have seen their bonds reprice significantly lower, and many commodity exchanges have either increased margin requirements or taken moves to limit trading. In the chart above, we can see how increases in margin balances (likely at the CME), resulted in cash held by non-bank institutions at the Chicago Fed increasing by the largest weekly delta since March 2020. These are all concerning events for commodity traders, but have relatively little chances of creating contagion in broader financial system as margin increases have been modest in the grand scheme of things and critical funding markets are fairly well insulated from the failure of a major commodity player.
Some have pointed to the run-up in credit default swap spreads on major banks as a sign that chaos in commodity markets could lead to solvency risk for banks with significant exposure in the sector. While it is true that spreads are wider than they have been in recent history, they are still far below where they were during times of material solvency risk such as March 2020, and the term structure of CDS spreads suggests this is more due to mechanical de-risking than acute solvency risk.
To expand on this last point, we can look at the cost of credit insurance for Citigroup in the CDS market for a range of terms from 6 months to 10 years. Looking at the most recent curve (white line), it is clear that premiums have expanded since last fall (blue line). However, they have expanded more at the longer end of the curve than they have in the near tenors, maintaining the curve’s moderate upward slope. This is the usual shape of a bank CDS curve, as it is normally very unlikely that a major bank like Citigroup would default in the next year or so, with the probability increasing slightly as term rises. In risk-off conditions like we have today, counterparties of Citigroup will hedge their exposures with CDS to meet tighter risk limits, mechanically steepening and raising the overall level of the CDS curve. This is in sharp contrast to the curve in March 2020 (yellow, orange, and red), when the short end of the CDS curve rose quickly and flattened the curve. On March 20, 2020 there was material risk of Citigroup being insolvent imminently as funding markets around the world were on the brink of collapse, and this risk was dominating pricing across the board. The shape of the curve today is much lees suggestive of imminent solvency risk and leans more towards required risk management during a sudden period of high volatility.
Finally, some conclusions from all this:
We are living through an acute geopolitical crisis, not a financial crisis. The financial system is functioning smoothly despite risks rising and spreads widening in some peripheral markets.
Funding markets have been under some stress but have not come close to using the full extent of their available backstops or need central bank intervention.
Commodity markets have seen some very severe disruption but it does not yet pose a material risk of a broader contagion to the banking sector.
Market measures of risk have risen but mostly stabilized over the week since March 7, suggesting the situation is somewhat stressed but not actively worsening.
That is all for now! Apologies for the brevity and rough editing in this latest Chartbook, as it was assembled in a bit of a rush. Hope it was interesting if you made it all the way to the end and look forward to writing the next one in the near future :)
Cheers,
DC


Thanks!
Thanks DC, enjoy the insights! Two questions if you can:
1) Do you have any thoughts as to why ESTRON keeps grinding lower?
2) Can you give any insight into why SOFR since mid-March 21 has flat-lined into a seemingly policed policy rate (FF looking)?
Thanks!