
Chartbook #14
December 27, 2021

Hello everyone and welcome back to the Chartbook! With the Eurodollar market getting some attention lately on news of an inversion, let’s have a look at what makes this market unique and put the recent events in some perspective. To start, this Chartbook will review the basics of Eurodollar futures and their role in interest rate markets. Then, the next section will discuss order matching, combos, implied and hidden liquidity, and their implications for trading. Finally, the last section will look at some current market data and of course the inversion. Okay, let’s get to it!
Eurodollar Futures Basics
The 3 Month Eurodollar futures were launched just over 40 years ago on December 9, 1981 and have since become one of the most popular and liquid interest rate products in the world. As discussed in this NY Times article from shortly after the launch, Eurodollars were innovative at the time as the first futures product to settle without a deliverable underlying. While futures on deliverable financial products such as bonds had become popular during the 1970s, Eurodollars started the trend of cash-settled futures that continued into the 1980s with products like equity and US dollar index futures. Similar to how the universally followed S&P E-mini futures are settled at the value of the S&P 500 at maturity, Eurodollar futures are settled in cash based on the 3 month Libor rate. Specifically, the final settlement price of a Eurodollar futures contract (in dollars), is given by:
Index = 100 - R, where R is the 3 month Libor rate at contract expiry
This straightforward inverse relationship with interest rates makes Eurodollar futures a natural instrument for the hedging of loans. If a lender is worried about lower interest rates in the future making loans less profitable, they could purchase the futures to hedge their exposure (and vice versa for a borrower). The size of a Eurodollar contract is set by a multiplier of 2500 to roughly hedge a $1 million exposure per contract. This means that a 0.01 move in the settlement index (equal to a 1 basis point move in 3 month Libor), corresponds to $25 in profit or loss per contract. Since a 1 basis point annual rate for 3 months on a million dollars yields $25 of interest, the multiplier aligns the size of a single contract with the interest exposure of a $1 million loan for convenience.
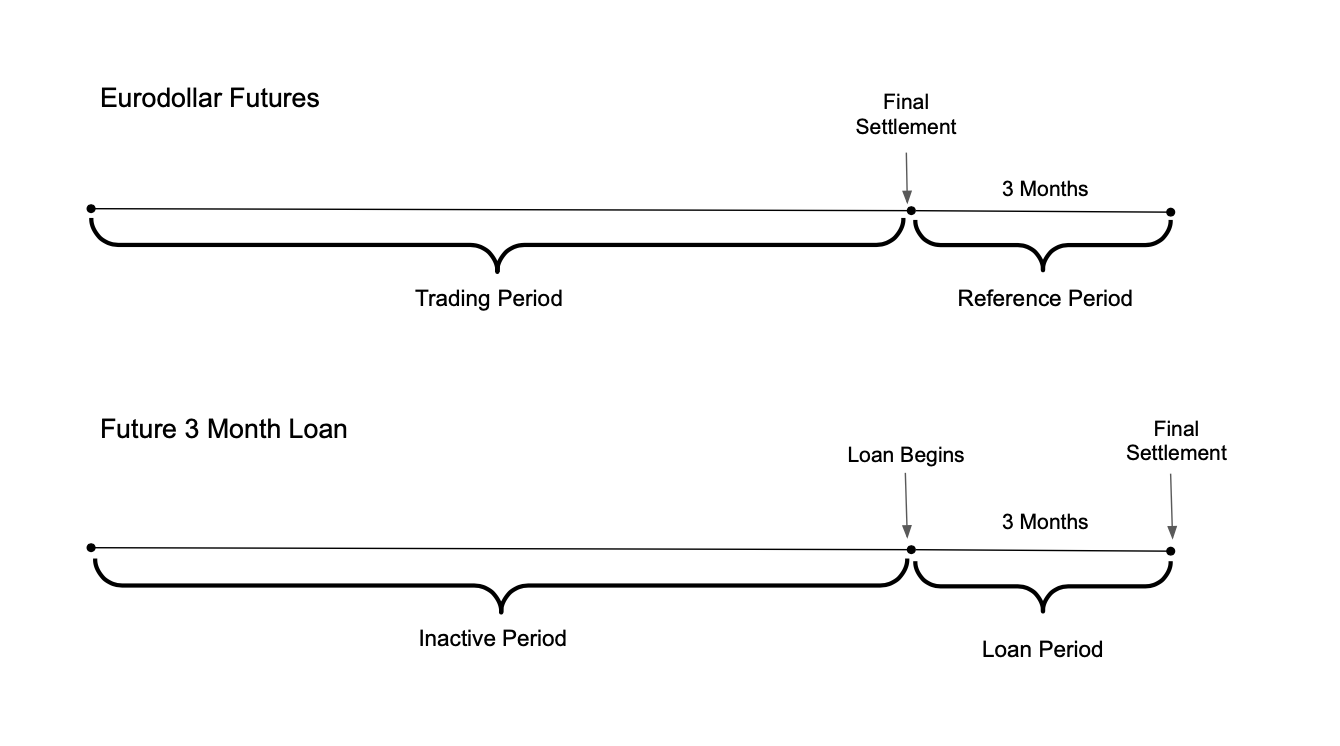
The diagram above shows the analogy between a Eurodollar futures contract and a loan starting at the date of expiry. While the economics of a real loan and a futures contract are similar, we can see here the first key difference between the Eurodollar market and most other fixed income markets: linearity versus convexity. If one were to imagine a loan starting at the date of futures maturity, it would be another 3 months before final settlement of the loan occurred. This means that a perfect hedge would not only cover changes in interest rate up to the time the loan begins, but also how these changes affect the time value of money over the period of the loan itself. Eurodollar futures do not cover this second-order effect - they simply provide a linear payoff based on the rate at time of expiry. It is somewhat unusual in fixed income markets to see a truly linear return as most loans, bonds, and swaps have some degree of convexity in their payoff. This quirk has led practitioners to adjust Eurodollar futures rates to be directly comparable to rates of non-linear products using various models, many of which are evolutions of the work of George Kirikos and David Novak first published in a 1997 issue of Risk magazine. Since the adjustment is usually small, however, it is useful to keep in mind the analogy of a Eurodollar contract as a synthetic $1 million loan when thinking about how these products are used in practice.

With this background on what the basic Eurodollar contract does, let’s move on to the full series of 44 listed contracts, which is made up of 40 quarterlies and 4 monthlies at any given time. The chart above shows the closing prices of all 44 contracts as of December 23, with the quarterly contracts in their standard color code. As the name suggests, the quarterly contracts expire in the months of March, June, September and December, which are abbreviated as “H”, “M”, “U”, and “Z” respectively. Since 40 quarterly contracts are spread over 10 years, a specific contract can be identified by its month code and the last digit of the year it expires in (for example, the March 2025 contract is called “H5”). Groups of 4 consecutive quarterly contracts, called “packs”, are color coded for ease of reference and often traded together, as will be later discussed. When a quarterly contract expires, a new one is listed to expire 10 years in the future and the whole series shifts forward by one notch. At the near end of the curve, there are also 4 monthly contracts that expire on “off-months” where there is no quarterly contract listed (shown on the chart as the black dots). These are intended to provide extra granularity for very near-term rates and are much more lightly traded than the quarterly expiries. When a monthly contract expires, a new one is listed in the next open slot on the curve in between quarterlies.
Market Structure
Now, let’s look at the main factors that make Eurodollar markets unique: order matching and combos. In most equity and futures markets, limit orders that are resting in the book are matched based on the time at which they arrived. Orders that arrived earlier are filled ahead of orders at the same price that arrived later in a process that is often called First In First Out (FIFO) matching. Resting orders in the Eurodollar order book, however, are matched on a pro-rata basis. To understand what this means and what difference it makes, let’s look at a hypothetical order book and work through a few examples of different order matching algorithms.

The diagram above shows an order book with 9 limit orders resting on both sides and an aggressor buy order entered at 99.02 for 200 contracts. The limit orders are arranged in the order in which they arrived, with earlier orders located near the center column and later orders queuing up to either side. In this case, the matching process for a FIFO market is fairly straightforward:
The limit order for 50 contracts gets filled in its entirety
The limit order for 250 contracts gets partly filled for 150, with 100 remaining
The limit order for 500 contracts gets no fills
This type of order matching incentivizes participants to place orders quickly and secure spots at the front of the queue. The main trade-off participants have to grapple with in FIFO markets is price versus the probability of a fill. Placing a limit order further from the best bid/offer provides some price improvement, but also increases the risk of the price moving away from the order without it being filled.
Now say we saw this same situation in a pro-rata market. In this case, the matching will be done based on each limit order’s share of total available size (regardless of the timing of order placement):
The limit order for 50 contracts gets 6.25% of the allocation (12.5 contracts)
The limit order for 250 contracts gets 31.25% of the allocation (62.5 contracts)
The limit order for 500 contracts gets 62.5% of the allocation (125 contracts)
In this type of market, placing orders quickly is not nearly as important, as it does not help participants get an advantage over later orders. The pro-rata market also creates a new trade-off with respect to order sizing. Placing a larger order helps a participant get a larger share of the total, so oversizing limit orders and cancelling the excess once the desired fill is achieved is a viable strategy to obtain faster execution. On the flip side, this creates the risk of getting overfilled by a very large aggressor order. Traders in a pro-rata market must balance the benefit of oversizing their limit orders with the risk of getting more than they bargained for, a very different dynamic from what happens in more common FIFO markets.
Eurodollar futures are matched by a “pro-rata with top” algorithm, which incorporates some elements of both FIFO and pro-rata. To incentivize participants to place an order quickly if it improves the best bid/offer, the Eurodollar matching engine marks the first limit order to arrive at a new best price as the “top” order. This order is must be fully filled first before any pro-rata allocation can take place, after which there is no “top” order until a new best bid/offer is established. Also, as seen in the previous example, pro-rata matching can sometimes generate fractional contracts if applied naively, which would be impractical in real markets. The Eurodollar matching engine rounds down when calculating the allocation and will not execute fills smaller than 2 contracts on a pro-rata basis. This leaves a residual amount after the pro-rata stage which is then allocated using a conventional FIFO algorithm. To tie all this together, let’s go through how the Eurodollar matching engine would handle the orders in the example. Assuming there is no top order, the match would proceed as follows:
The limit order for 50 contracts gets 6.25% of the allocation (rounded down to 12)
The limit order for 250 contracts gets 31.25% of the allocation (rounded down to 62)
The limit order for 500 contracts gets 62.5% of the allocation (125 contracts)
The residual contract left over is allocated on a FIFO basis to the limit order for 50 contracts, bringing the total up to 13
Now assuming that the first order in the queue happens to be a top order, the sequence of events would be:
The top limit order for 50 contracts gets filled in its entirety
The limit order for 250 contracts gets 1/3 of the remaining (50 contracts)
The limit order for 500 contracts gets 2/3 of the remaining (100 contracts)
There is no residual piece so the matching event is over
So what are the implications of these rather technical factors on how the Eurodollar markets actually trade? Firstly, due to the advantages of oversizing limit orders, the order book in Eurodollar futures is usually extremely thick (on-screen liquidity is orders of magnitude larger than the average trade size). Due to the relatively large tick size (0.5 basis points) and the top order functionality incentivizing traders to place orders at any available mid price, the bid/offer in Eurodollars is almost always at the narrowest possible spread of a single tick. Finally, there is a lot of uncertainty about if and when a resting order will actually be filled. A much more detailed game-theory model for the consequences of the Eurodollar matching algorithm was published by Jonathan Field and Jeremy Large in a 2008 paper, but for rest of this post the qualitative view should be enough.
One further consequence of the uncertainty in execution is that entering or exiting a complex multi-leg position may be difficult if one tries to trade all the legs separately. Since these positions are common among hedgers and speculators, the ability to trade in and out of the most popular combos as a unit has been built into the market. The two most straightforward combos are packs and bundles, which are simply strips of consecutive quarterly contracts that can be traded together. Packs consist of four consecutive contracts and are usually referred to by the color codes mentioned earlier. The white pack, for example, consists of the first 4 quarterly contracts on the curve, the red pack the next 4, and so on. Bundles are similar to packs but can consist of any number of consecutive contracts (up to the entire 40). If a trader wishes to buy or sell a pack or bundle, they can place an order in a separate order book that corresponds to the specific combo, where it can be matched with other orders in that combo. Once a combo is traded, the individual legs are assigned prices through a process described on page 12 of this guide and can then be traded separately as normal Eurodollar futures positions.

Besides the pack and bundle, there are several tradable combos that allow participants to take long-short positions along the curve to play the slope and curvature, five of which are shown in the diagram and described below.
Spread: consists of buying a contract and selling a later contract, and is commonly used to trade the slope of the curve.
Butterfly: consists of buying a spread and selling a later spread, with the middle leg overlapping. The butterfly is used to trade the relative slopes of two segments it spans, or in other words, the curvature.
Condor: similar to a butterfly but the middle leg does not overlap, also used to trade the relative slope
Double Butterfly: consists of buying a butterfly and selling a later butterfly, with the middle two legs overlapping. The double butterfly is used to trade the relative curvature of the three segments it spans, or in other words, the third derivative of the curve
Month-Pack: consists of buying 4 units of a individual contract and selling the immediately following pack. The month-pack is similar to a spread, but one of the legs is a pack instead of an individual contract
Not shown in the diagram are the pack spread, the bundle spread, and the pack butterfly, which are the same as the standard spread and butterfly except the legs are packs or bundles instead of individual contracts. Similarly to the regular packs and bundles, all these 8 types of combos have their separate order books and are deconstructed into their individual components as soon as they are traded (see page 16 of the same guide for the details on how these combos are disassembled). In terms of order matching, there are some differences between how combos are matched:
Spreads, Butterflies, Condors, Double Butterflies, Pack Spreads and Pack Butterflies are matched using the same “pro-rata with top” matching algorithm as outright Eurodollar futures
Packs, Bundles, Month-Packs, and Bundle Spreads are matched using a FIFO algorithm
While the combos have their own order books and some of them even have different matching algorithms, they are not completely separate from the outright Eurodollar order book due to implied order functionality. Orders in one order book can be “implied” to other order books which combine to the same position and executed even if there is no match in the original order book, which gives rise to the phenomenon of implied liquidity.

This diagram shows an example of how this would work in practice with two outright Eurodollar contracts and the spread between them. The implied liquidity here is created by the fact that buying H2 outright is the same as buying H3 and an H2-H3 spread. If one were to place a bid at 99.62 for the H2 contract on the right, it would match with the offer for 210 contracts resting at that price and also with the offers at 98.785 in H3 and 0.835 in H2-H3. While there are only 210 contracts of liquidity available at 99.62 in the outright H2 order book, the additional 954 contracts available through the implied order book are visible to traders and automatically merged in by the matching engine.
Since February 2014 this functionality only applies to first-generation implied orders, which are created by combinations of resting outright or combo orders. Second-generation implied functionality, which applies to combinations involving a first-generation implied order as one of the components, was turned off as it made large matching events excessively complicated. This made the liquidity available through second-generation implied orders become hidden, as it is no longer visible to traders or matched automatically. Hidden liquidity can, however, still be exploited by sophisticated traders to obtain better execution or sometimes even execute risk-free arbitrage trades when the market is significantly dislocated. The methods used for computing and taking advantage of this hidden liquidity are described by Edith Mandel in a great talk from Quantcon 2016 for readers interested in exploring this area further.
Current Market Events
With all this technical background out of the way, let’s now turn to what is going on in the markets recently. Since much attention has been focused on the inversion in a few contracts expiring around 2025, looking at one of the spreads that inverted seems like a good place to start.
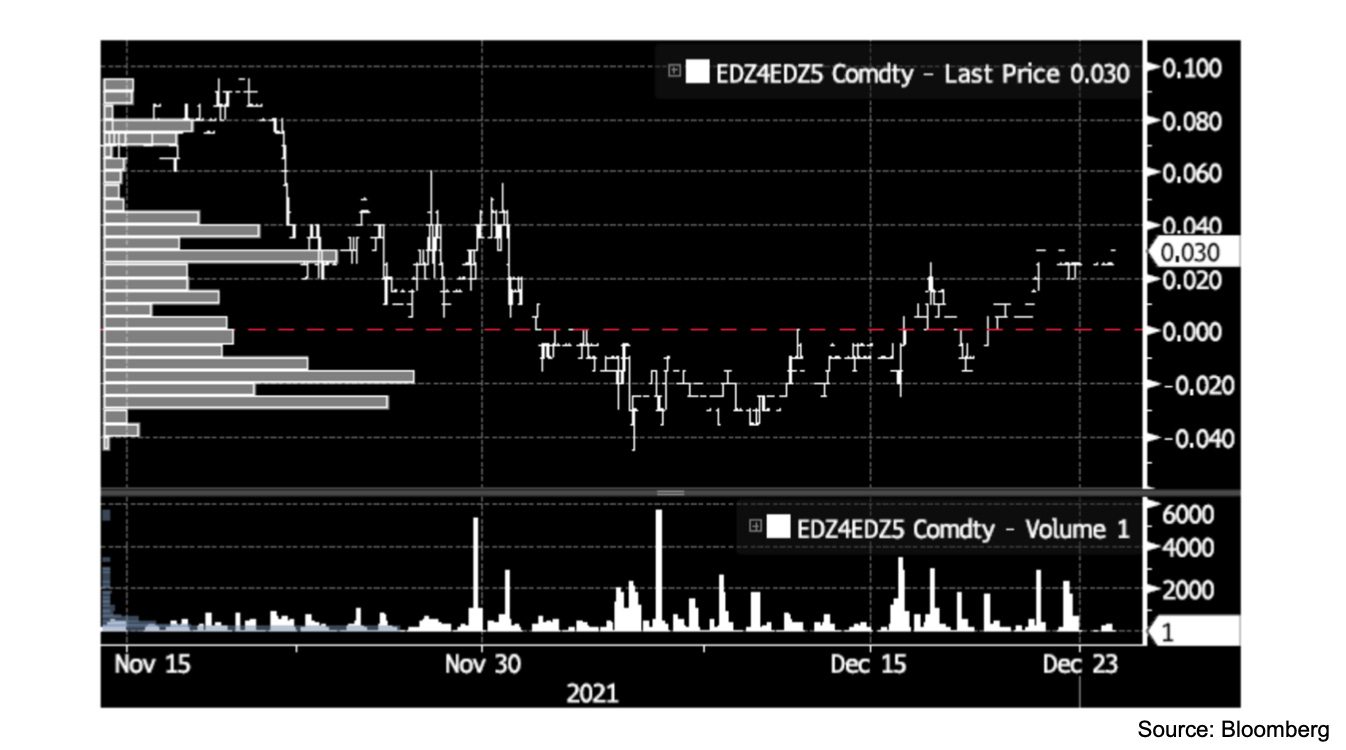
This chart shows the latest 30 days of trading in the Z4-Z5 spread, which hit a peak inversion of 4.5 basis points on December 3. The gray bars on the left side of the chart show the volume traded by price over the 30 day period. From this volume profile and the volume bars at the bottom of the chart, we can see there was little trading in this spread until about the last week of November, when it started coming within a few basis points of an inversion. The vast majority of trading has occurred between +3 and -3 basis points, which suggests it has mainly been driven by speculation as to whether or not the spread would invert / un-invert. While it has been suggested that an inversion indicates concern from hedgers about future economic conditions, this is unlikely as hedgers are not very active in this part of the Eurodollar curve.
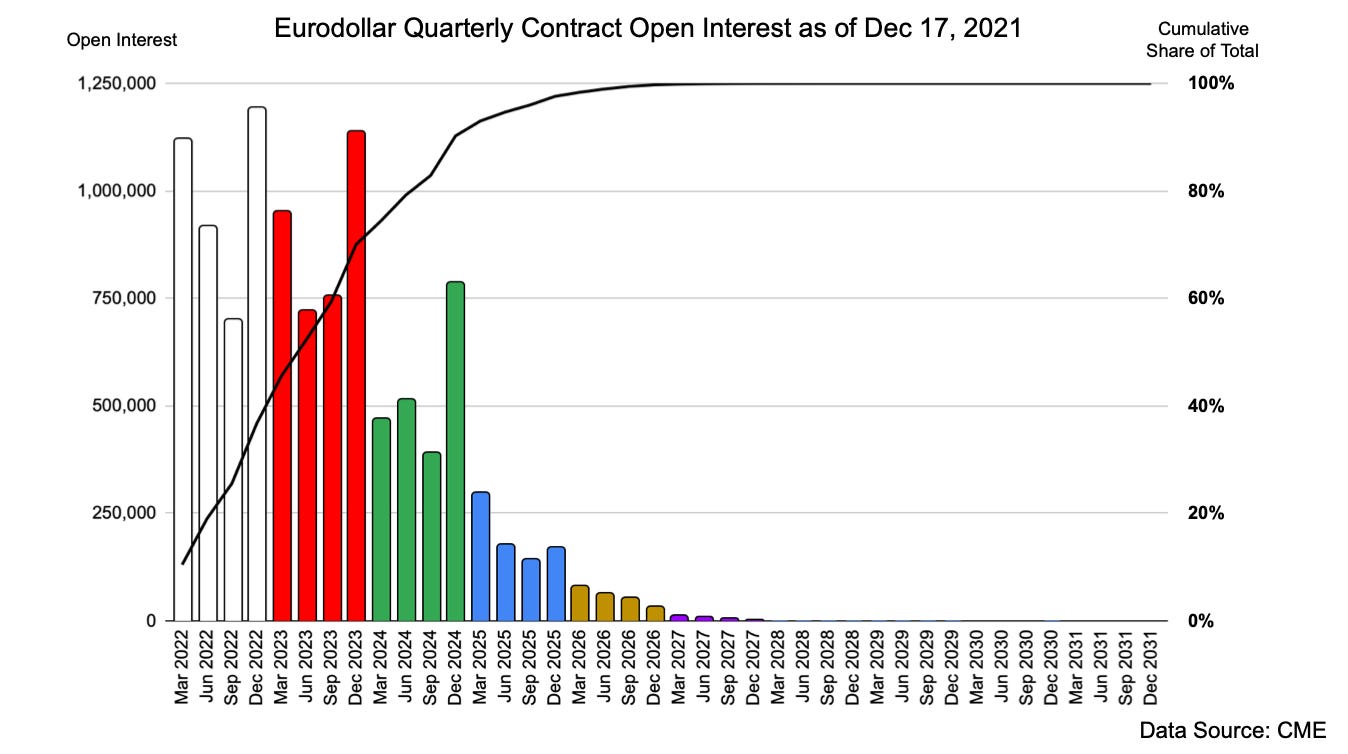
A straightforward way to see this is by looking at the open interest across the quarterly contracts and the cumulative share of the total that expires before a given date, as shown in the chart above. From this we see that about 90% of the open interest in quarterly contracts is located in the white, red and green packs, which all expire by December 2024. These first three years are the segment of the curve where hedgers are active, while the further out years are much more influenced by speculators with little to no impact on the real economy. The December 2025 contract that makes up the far leg of the spread discussed has less than 200k in open interest, meaning that some individual trades in the Z4-Z5 spread (for a few thousand contracts) can have a material impact on total positioning in this contract. An inversion in Z4-Z5 is thus a very weak signal for anything in particular going on in the economic environment, and more indicative of a few large traders placing bets on a relatively minor move.

For a more economically relevant view we can focus on the first few years of the Eurodollar curve, which have also seen some significant moves in recent months. The chart above shows the move in this segment of the curve since the start of June, with the very active Z2, Z3, and Z4 contracts highlighted. Back in June, the curve was very linear from December 2022 through December 2024, with the market pricing in a steady increase in rates over this time period. During the last 6 months, however, the curvature in this area has increased dramatically. The steady increase in rates is now priced in to the end of 2023, after which further increases in rates are seen as unlikely.

As expected, this shift in curvature can be seen reflected in the price of the Z2-Z3-Z4 butterfly, which has moved from around zero in June to almost 50 basis points. All this suggests a market narrative that rates will rise roughly as projected by Fed policy makers for two years and then reach their peak for this cycle. To see if this narrative is idiosyncratic to Eurodollars or supported by other fixed income markets, we can put the Eurodollar curve in the context of other short-term rates curves.
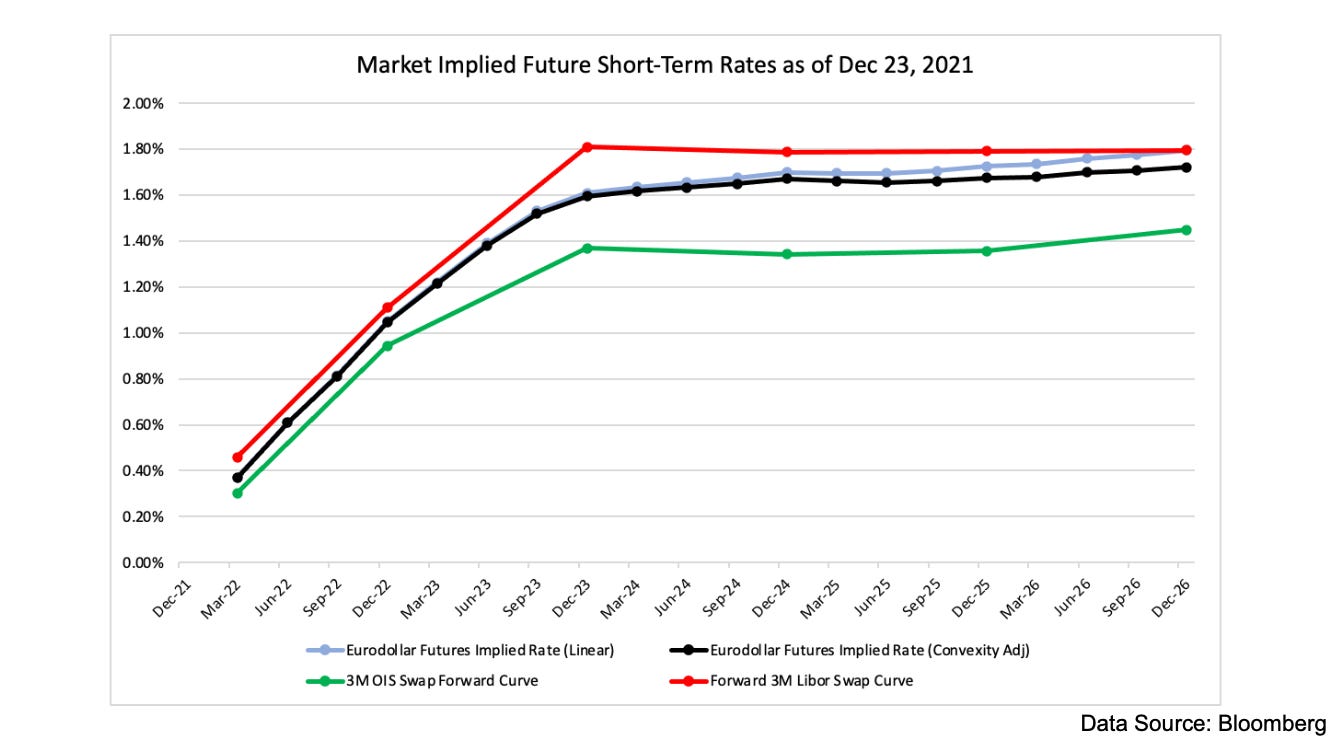
This last chart shows implied rates from the Eurodollar curve (both naively and convexity adjusted) superimposed on the forward curves for 3 month Libor and 3 month Fed Funds OIS swaps. We can see a broad consensus in the market that rates will stop rising around the end of 2023, with the Fed Funds rate peaking just below 1.5%. Since the Fed Funds rate in the previous cycle peaked with a hike to the 2.25-2.5% target range, this reflects a view that the trend towards lower terminal rates that has held up over the last few business cycles will continue. While this seems reasonable given the history of the last 40 years or so, there are many factors that could shift this terminal rate expectation higher or lower in the next two years. As we enter the tightening cycle over the course of 2022, these changing expectations will likely surface as volatility in the 2024 and 2025 segments of short-term rates curves.
That is all for now! Thanks for reading if you made it all the way to the end and for making the Chartbook so fun to write in 2021. Hope everyone has a great end to the year and look forward to seeing you back in 2022 :)
Cheers,
DC