


Hello everyone and welcome back to the Chartbook! With the third quarter of 2021 in the books, let’s look back at how the US money market has evolved in the year so far and consider where things could go from here. Since short-term rates have been stable at very low levels for the entirety of the year, most of the charts will focus on quantities and flows (where most of the action has been) as opposed to prices. To start, we can look at the changes in Federal Reserve assets, which have increased mostly on autopilot this year as the Fed continues to buy about $120B a month in Treasury and Agency securities.
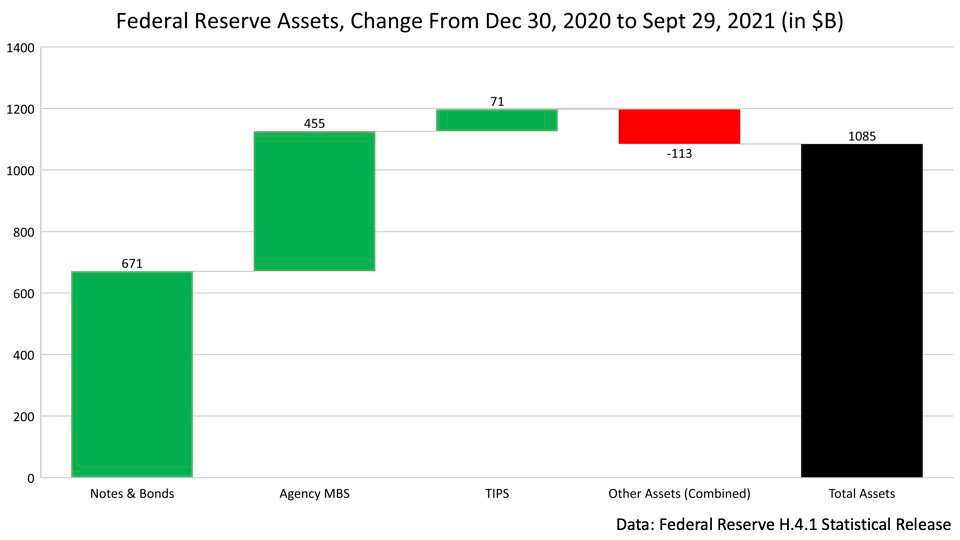
In this chart we can see that the Fed has purchased about $740B in Treasury securities between fixed coupon notes/bonds and TIPS, and about $450B in Agency MBS. Treasury bills have remained part of the Fed’s balance sheet assets, but since the level has not changed since March 2020 they are excluded here. Adding to this a small decline in the Fed’s other assets due mainly to the roll-off of emergency lending facilities leaves a $1085B total increase in assets for 2021 so far, right in line with what we would expect after nine months of $120B monthly growth. Since the purchase of assets by the Fed creates an offsetting liability, we would also expect the liabilities side of the Fed’s balance sheet to increase by a similar amount. However, on the liabilities side we have also seen a reallocation of Fed liabilities from public hands (the US Treasury) to private hands, resulting in private sector Fed liabilities increasing by significantly more than the asset growth for the period.
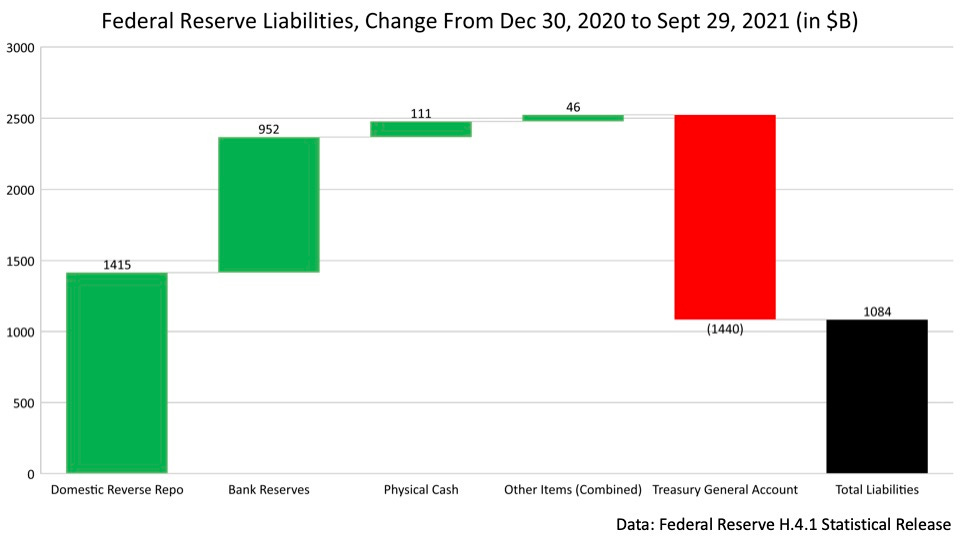
This chart shows the effects of this reallocation and balance sheet growth on the liabilities side. Since the Treasury has spent down $1.4T of cash held with the Fed year-to-date, other Fed liabilities have had to grow by just over $2.5T to offset this decline and the overall growth of the balance sheet. While asset purchases and the draining of Treasury cash balances both create bank reserves directly, these have accounted for only about $1T of the offsetting increase. The largest contribution has come from the domestic reverse repo facility, where the US money market fund complex has converted $1.4T of Fed liabilities into this form. The large volume of conversion has been driven both by banks shedding assets and liabilities into money funds (increasing aggregate AUM of money funds) and funds losing other investments due to the reduction in the outstanding supply of Treasury bills. To better understand the Fed’s liability reallocation, let’s map out the three primary routes through which bank reserves have been created this year:
Fed buys securities, increasing the reserve balance of a primary dealer’s clearing bank
Treasury pays down maturing debt, increasing the reserve balance of the debt holder’s bank (note: since the Treasury reduced the quantity of bills outstanding this year, this mainly applies to bill holders who in aggregate received funds from the Treasury)
Treasury spends and sends out stimulus payments, increasing reserve balances of the recipient’s bank
Though these transactions may also create deposits on the bank liability side that we will discuss later, we can first focus on the bank asset side where reserves are created mechanically through Fed and Treasury action. Note that the first two routes create reserves mainly at large money center banks, who clear transactions for the primary dealers or maintain accounts for large holders of maturing Treasury bills. The third route creates reserves at all banks, since recipients of Treasury payments and stimulus are much more widely distributed throughout the country. Also note that once reserves are created, they can be pushed to other banks through the purchase of assets or paydown of debt, or leave the banking system in aggregate through the money market fund complex. This may be beneficial to some banks who do not wish to hold a high level of reserves, since that may worsen the firm’s leverage ratios. With this background on how and where bank reserves are being created, we can now look at where they are accumulating by examining the Fed’s H.8 statistics. The Fed collects this data by requesting banks voluntarily submit a weekly Form FR 2644 on the state of their balance sheet at the close of business every Wednesday. While the individual FR 2644 submissions are confidential, the H.8 data release gives us estimated weekly total balance sheet levels across the US banking system, split by small domestic banks, large domestic banks, and foreign bank offices.

Here we can see the year-to-date changes in cash asset levels across these three categories. Though cash assets here include physical cash held at bank branches as well as bank reserves with the Fed, we can safely assume most of the variance is coming from changes in reserve balances. From the chart, we can see that foreign bank offices have accumulated the most reserves as a group, with about half of the overall increase. Small and large domestic banks have about equally shared the remaining half, though the small banks have accumulated reserves much more smoothly. The continuous uptrend in these small bank balances is likely attributable to ongoing Treasury payments to individuals, which were at their peak in the first quarter, and the more passive attitude of smaller banks towards managing their reserve levels. The large banks have more aggressively managed their reserve growth throughout the year, taking in reserves in the first and third quarters but pushing them away in the second quarter. We can also observe the volatility in quarter-end balances at foreign bank offices since March 31 and June 30 happened to be reporting dates this year. On these days, to optimize balance sheet metrics for other filings, foreign bank offices shed assets and liabilities temporarily (more on this when we discuss the bank liability side).
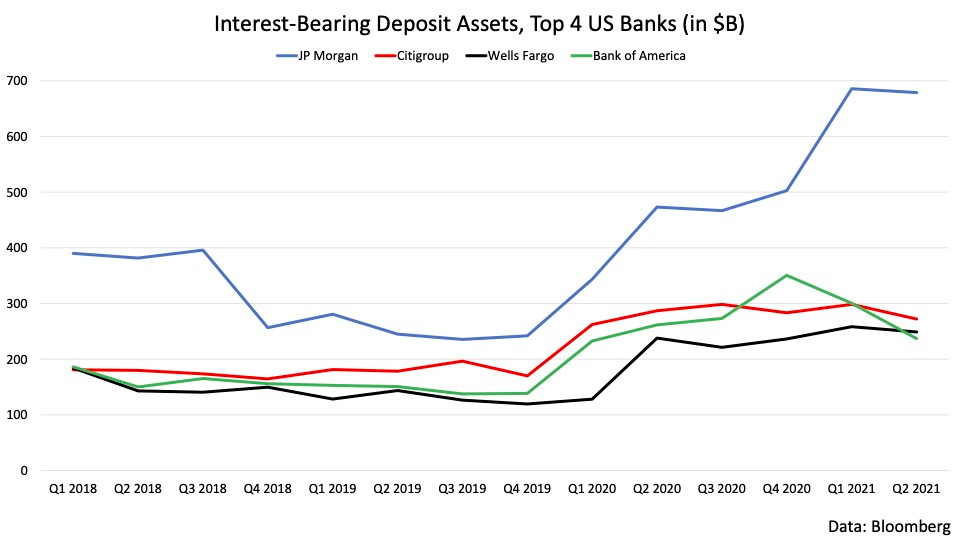
For more detail on how large banks are actively managing their reserves, we can look at reported levels from recent 10-Qs of the four largest US banks. Though these figures are only released quarterly and latest release was Q2 2021, we can pick up on some trends here to extrapolate likely bank behavior. From the chart, we can see that two of these banks, Wells Fargo and Citigroup, have held their reserves roughly flat for a few quarters and likely not contributed meaningfully this year. Of the remaining two, JPMorgan added about $200B in the first quarter, while Bank of America shed about $100B over the first two quarters. If we assume that this trend has persisted into the third quarter, JPMorgan would be the largest contributor to the net ~$200B increase in large bank reserve balances seen so far for the year, with the remaining large banks offsetting Bank of America’s reduction in reserves.
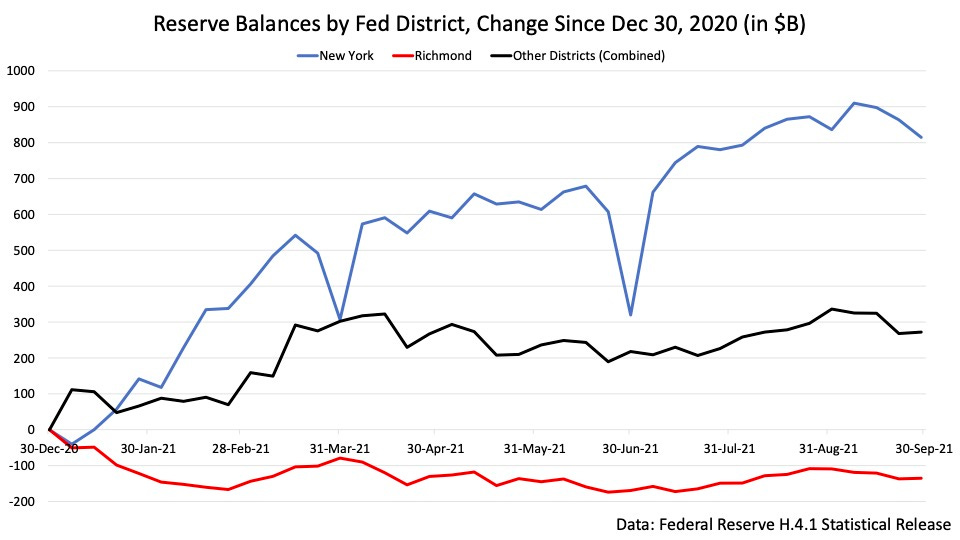
We can see evidence for this behavior in the distribution of reserve growth by Fed district, which are reported in Table 6 of the weekly H.4.1 report. The New York district holds reserves for JPMorgan, many of the large domestic banks, and most of the foreign bank offices (as we can confirm by observing the same quarter end seasonality). As one of a few exceptions among the large domestic banks, Bank of America holds its reserves in the Richmond district, which was the only Fed district reporting a material decline in its balances this year of about $150B. If we take this to mean that large banks including JPMorgan in the New York district added $350B to make up the overall $200B added by large banks, the overall change in the New York district is explained neatly by this and the ~$500B added by foreign bank offices.
Now let’s turn to how banks can reduce their level of reserves individually within the banking system. The most straightforward way to do so is to simply purchase securities and transfer reserves to other banks in the settlement process. The H.8 data also tracks levels of investment securities in the three bank categories, which we can look at next to see how securities purchases have affected bank asset levels so far this year.
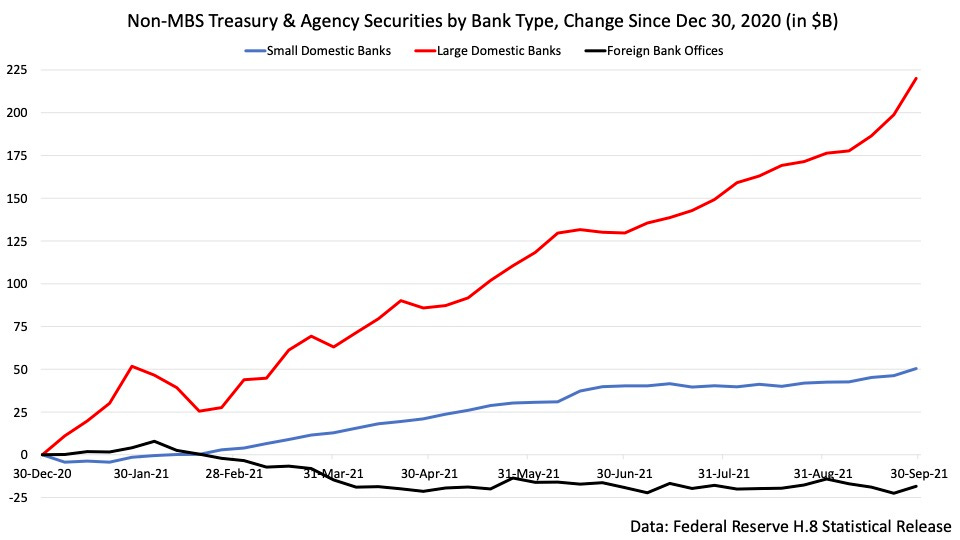
This chart shows the change in Treasury and Agency securities excluding MBS so far this year, by bank type. We can see the large domestic banks have been most active here, accumulating over $200B in (mostly Treasury) securities for their investment portfolios. This is to be expected as a number of large banks, most prominently Bank of America, have mentioned that they purchased Treasuries as a way to boost income in earnings calls (see comments here on page 11). Small domestic banks have also steadily accumulated these securities, though in much smaller size than the larger firms. Foreign bank offices have not been very active here, as suggested by their large rise in reserve balances implying they are hoarding and not deploying reserves.

We can also look at bank holdings of Agency MBS securities in the H.8 data. Small domestic banks have been more active here, adding about $130B and large domestic banks have about matched their non-MBS accumulation with $200B. Foreign bank offices have stayed flat on MBS holdings as well.
So far, we have discussed where and how reserves are being created, how they can be reallocated between banks, and how they can be converted into Fed repo liabilities through the money market fund complex. But what is happening on the other side of bank balance sheet, and how is it affecting what they are doing with their reserves? To unpack the details here we must look at the kinds of deposits that are created by Fed and Treasury actions, and consider the differences between them. Note that deposits can also be created through entirely private-sector activities unrelated to the Fed and the Treasury, but we can focus here on deposits that have been created mechanically through policy actions. Let’s return to the three routes of bank reserve creation discussed earlier, and consider the offsetting deposit created on the bank’s liability side simultaneously:
Reserves created through Fed asset purchases: When a clearing bank receives reserves, it credits the (sometimes affiliate) dealer’s account with a deposit. Since the dealer is most likely sourcing securities from institutional clients, these flow through to institutional brokerage deposits for the bank.
Reserves created through the paydown of Treasury bills: Since money market funds and institutional cash pools are large holders of Treasury bills, maturing bills create brokerage or corporate non-operating deposits for banks receiving reserves.
Reserves created through Treasury spending and stimulus payments: Stimulus payments going out to individuals create retail deposits for receiving banks, and corporate accounts receiving cash for normal business operations create operating corporate deposits.
The main reason these are very different propositions for the banks involved is the Liquidity Coverage Ratio (LCR) rule introduced as part the Basel III regulatory framework (see summary here). Under the rule, banks are required to hold sufficient high-quality liquid assets (HQLA) to fully cover expected net outflows during a model 30 day stress scenario. To calculate outflows for the LCR stress scenario, bank deposits are subject to different outflow rates depending on the type of the depositor.
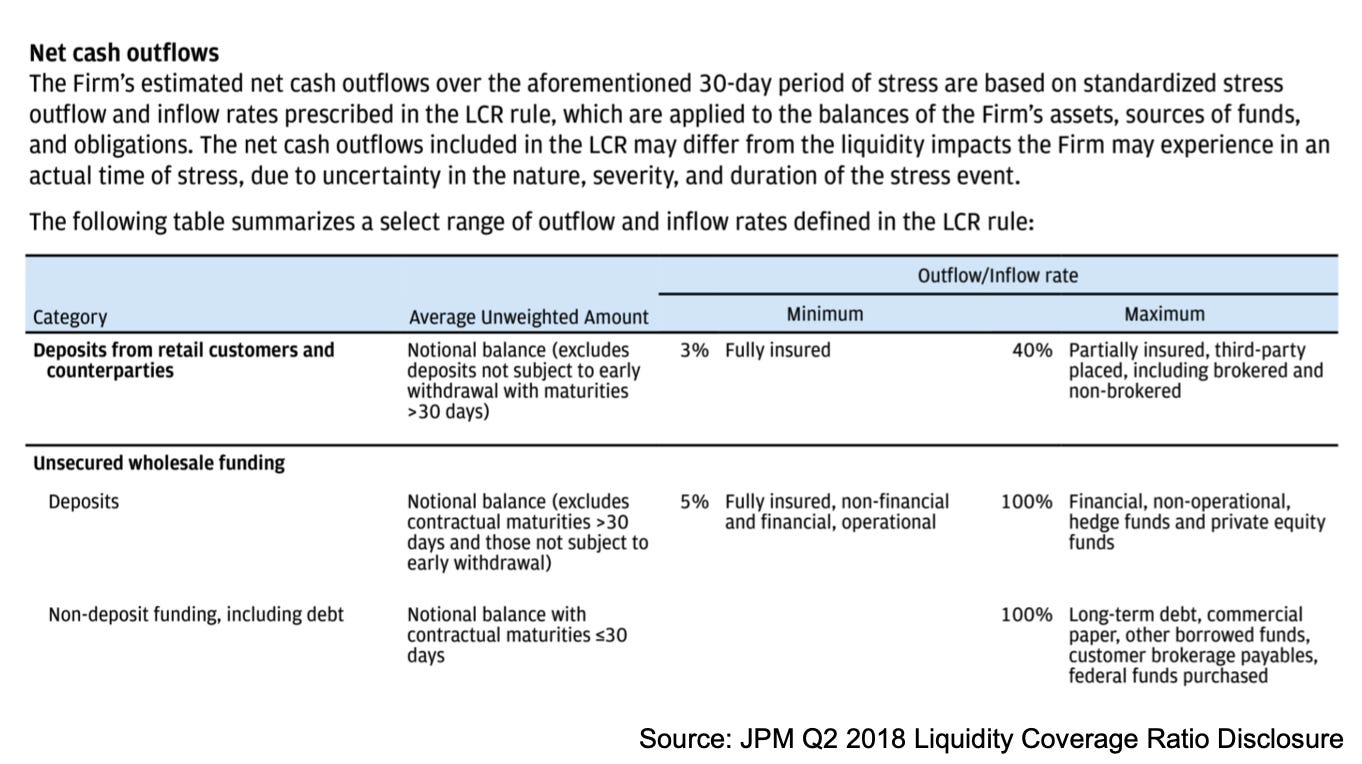
Small retail deposits fully insured by the FDIC (accounts under $250k in most cases) are considered the most stable and subject to the lowest outflow rate, shown here as 3% for JPM’s Q2 2018 calculation (see full report here). Corporate operating deposits, which are most accounts essential for normal business operations, carry a similarly low 5% outflow rate for their fully insured portion. Other deposits are however viewed as much less stable, with institutional brokerage deposits carrying an up to 100% outflow rate. This reality means that banks strongly prefer ‘sticky’ retail and corporate operating deposits which barely affect their liquidity ratios, and are averse to ‘hot money’ deposits which affect them significantly. Since bill pay-downs and Fed asset purchases create primarily hot money deposits, banks are eager to shed these liabilities if possible. If banks are very averse to a particular type of deposit, they can shed both the deposit and offsetting bank reserves to a money market fund. Meanwhile, fiscal spending and stimulus payments create attractive retail and corporate operating deposits, which banks seek to retain in place of less favorable sources of funding. Banks may use favorable types of deposit to upgrade their funding mix by paying down costlier borrowings or deploy the funds into securities as discussed earlier. With this background, we can look at year-to-date growth in deposits at banks, also reported in the H.8 data.

Here we can see that the large domestic banks have added over $600B in deposits so far, roughly matching the sum of the $200B increase in reserves and $400B increase in combined securities. Small domestic banks have also grown their deposit funding, adding about $500B at a steady pace. We can also observe the more active behavior of the large banks as their deposit levels have been much more volatile. This is likely a result of the larger banks receiving deposits from all sources, and being selective about which deposits to retain and which deposits to shed to money funds. Foreign banks have grown their deposits much less, and quarter end seasonality here too suggests that these deposits are not sticky. Finally let’s look at bank borrowings, which in the H.8 include repo borrowing and other forms of short-term funding.
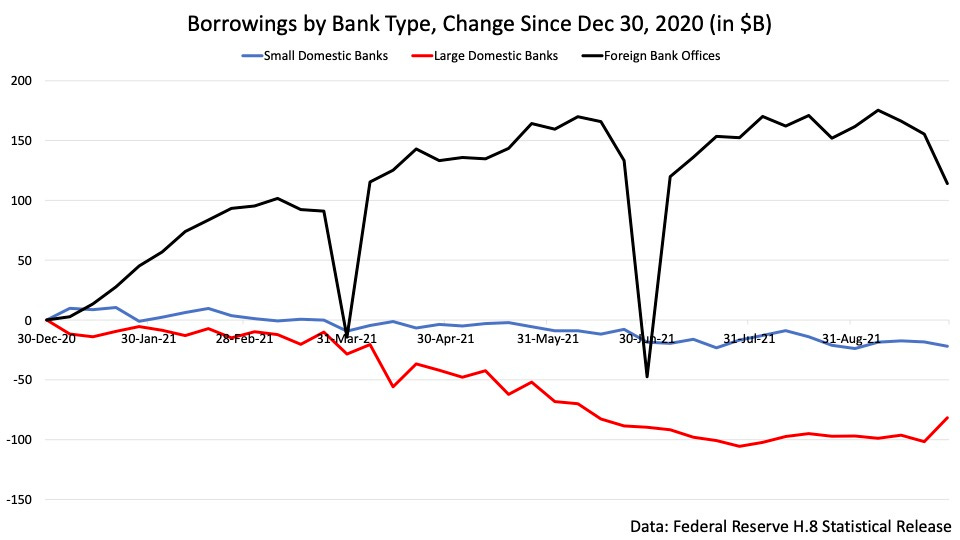
Here we see that foreign bank offices have dominated the growth in borrowings, adding over $100B to their reserves through short-term funding. These borrowings also decline sharply on quarter-ends, so we can conclude that the reserves foreign bank offices shed around those days are partly funded by deposits and more significantly by short term borrowings. In this way, foreign bank offices are effectively warehousing excess reserves by borrowing them at rates below the interest rate on reserves and simple holding them. Large domestic banks in this chart paid down about $100B in borrowings, and small domestic banks a smaller amount. Most of these declines were likely related to pay-down of balances borrowed from Federal Home Loan Banks (FHLBs), as discussed in much more detail by Zoltan Poszar in a recent note (link). This pay-down is evidenced in the decline of total assets of the FHLBs (see here) and results in additional reserves being transmitted to the money fund complex through the FHLBs pay-down of short term liabilities held by money funds on the other side of their balance sheets.
Finally let’s consider where we go from here. The expansion of the Fed’s balance sheet is currently expected to end midway through next year, after a roughly 6 month period of tapering. This means that we have roughly three months remaining of $120B monthly expansion before the taper period, or about $360B in balance sheet expansion. Then, if we assume the average rate over a straight-line taper is $60B per month, we would get an additional $360B for a total of $720B in Fed Balance sheet growth remaining until it flatlines.
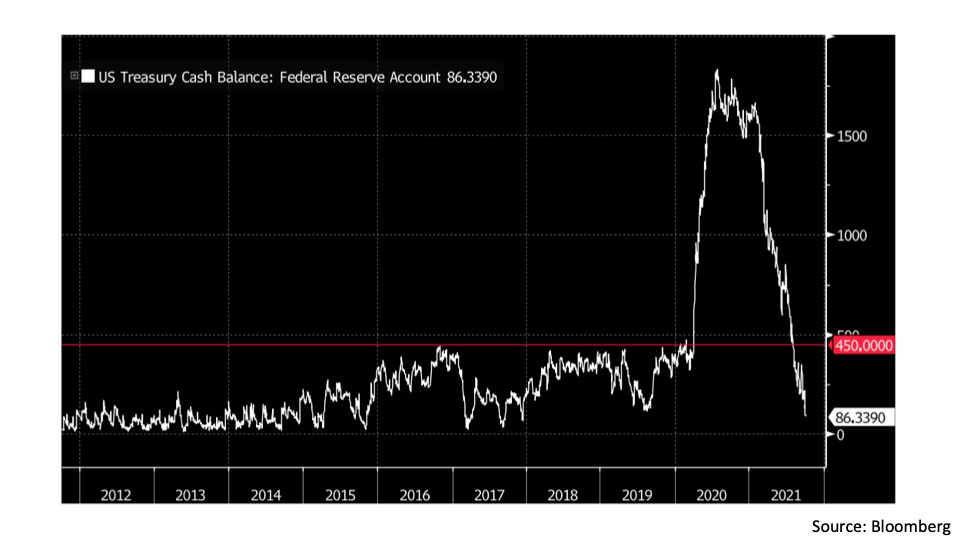
With the Treasury cash balance at only $86B as of October 7 however, we would expect some part of this balance sheet growth to be offset by Treasury cash on the liability side, as opposed to the Treasury pushing Fed liabilities to the private sector most of this year. The Treasury is currently prevented from rebuilding its cash balance due to debt ceiling concerns, which initially flared up in August and September and have now been postponed until year end.
At some point in early-2022 the Treasury will likely rebuild this account to its former level. If we assume it goes back to a pre-2020 high of $450B, this would mean about half of the Fed’s remaining $720B in balance sheet growth will be absorbed on the liability side by the Treasury account, with only about $360B in growth left for bank reserves and reverse repos. We might expect the Treasury to fund this rebuild of its cash balance by raising the issuance of bills, which has been significantly reduced in recent months as debt ceiling issues became acute. While the prospect of the Treasury borrowing $360B at the short-end and pressuring short-term rates higher may sound concerning, it is important to remember that money funds have added $1.4T in cash that is currently earning 5 basis points in the Fed’s reverse repo facility. If money market rates were pushed higher by increased demand for short-term funding from the Treasury, the reverse repo facility would go from setting a floor for short-term rates to setting a ceiling. Money funds would withdraw some cash from the reverse repo facility and deploy it into higher yielding bills, repos, or commercial paper, preventing any rise in short-term rates from getting far above the reverse repo rate.
We can probably expect current dynamics - large banks being selective with deposits and reserve growth, foreign bank offices warehousing reserves, etc. - to continue for the fourth quarter of the year, with a change coming in early-2022 as the Treasury rebuilds cash and the Fed begins to taper its asset purchases. This could see a period where mechanical creation of reserves and deposits quickly fades as a relevant factor to the US banking system in the first half of 2022, and we begin to see dynamics driven more by the run-up to rates liftoff.
That is all for now! Thanks for reading if you made it all the way to the end and hope to see you back for another one soon as we approach the year end and more interesting times for the money markets :)
Cheers,
DC
Just wanted to let you know we / I appreciate the effort and that it does not go unappreciated (even if comments aren't posted). Educational, valuable. Boom. Checkmate. Thank you.
Very informative, thank you!