


Chartbook #11
June 20, 2021

Hello everyone and welcome back to the Chartbook! In this week’s issue we will review the recent Fed policy announcement from June 16th and the effects it has had on the markets. For the first time in more than a year, the Fed has changed its administered rates, though the target range for overnight rates remains 0.00% to 0.25%. This technical adjustment is explained in the Implementation Note released alongside the decision to keep the target range unchanged.
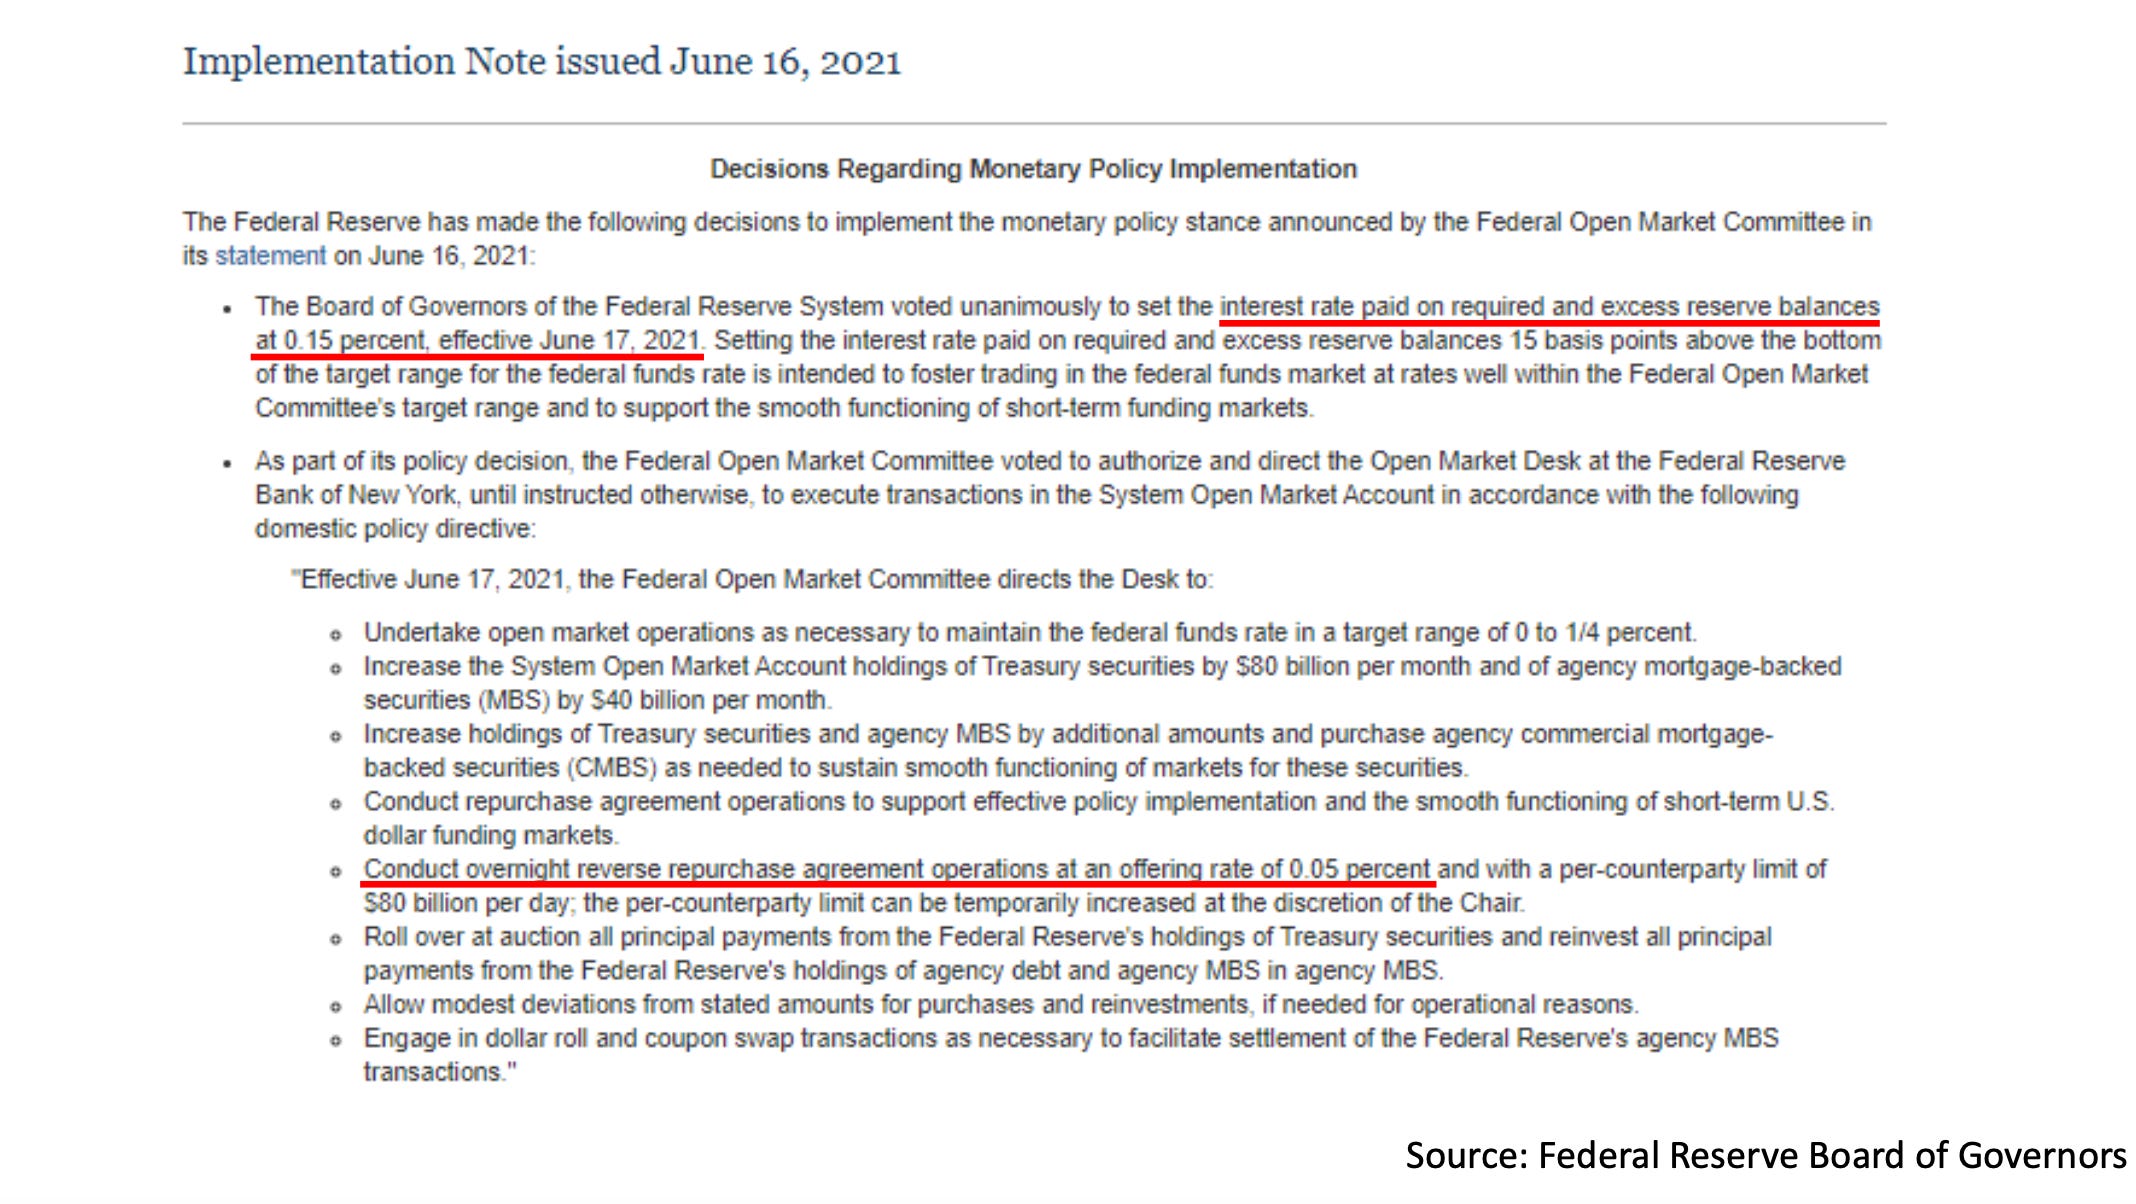
From the highlighted sections above, we see the Fed has changed the interest rate offered on reserves to 15 basis points (from the previous value of 10 basis points) and the offering rate on its reverse repo operations to 5 basis points (from the previous value of zero). These 5 basis point adjustments are then transmitted through the overnight rates complex into the broader money market. To see the effects, let’s check out a few key short-term rates and then discuss the various money dealing participants that are affected by them.
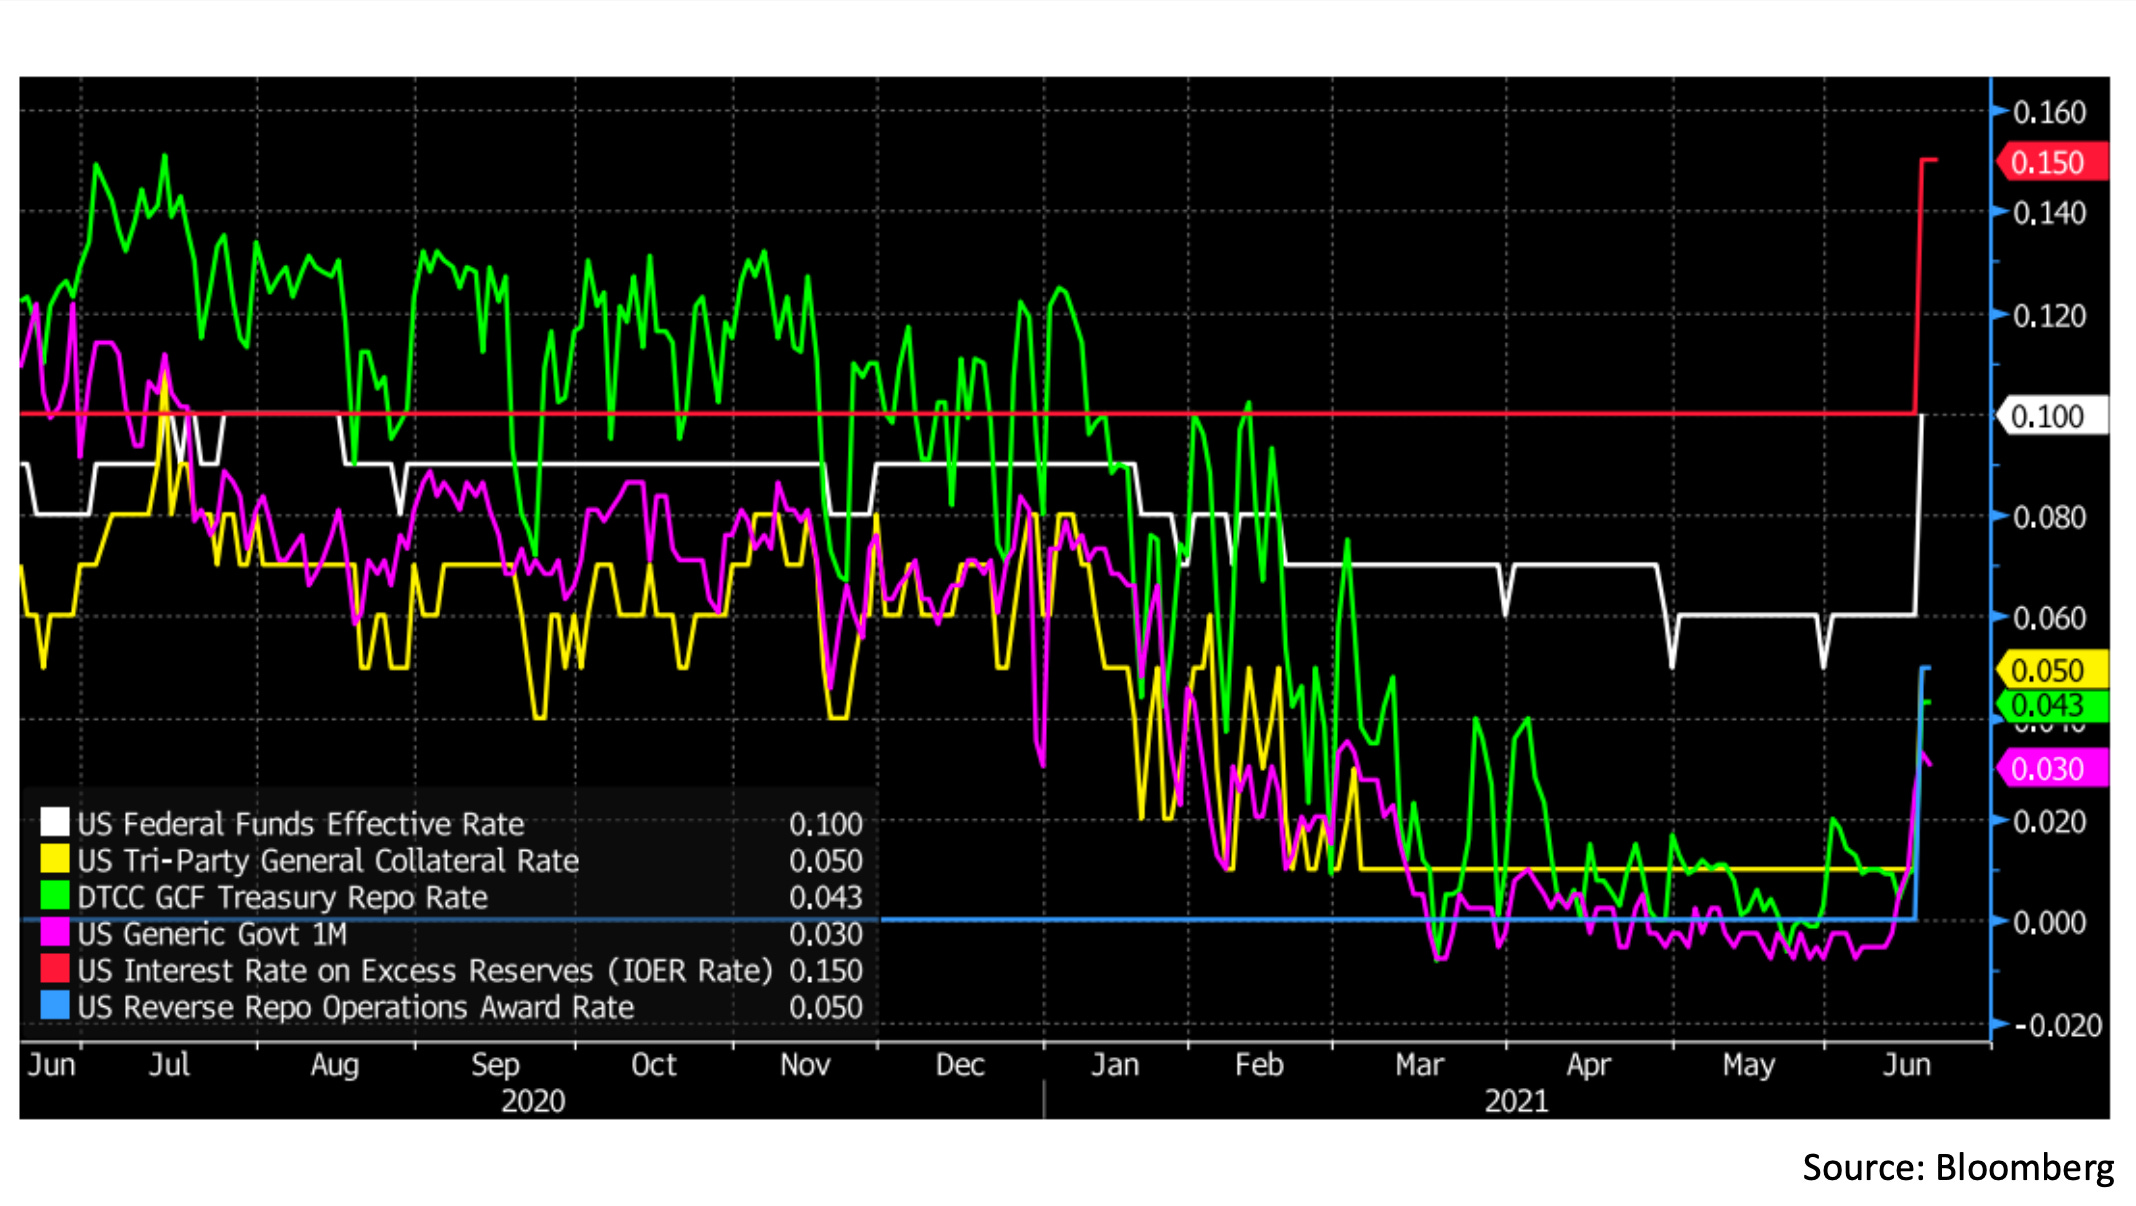
This chart shows the Fed’s administered rates and five key money market rates over the last year. Starting from the Fed rates, we have the interest rate paid on reserves (in red) and the offering rate on the NY Fed’s reverse repo facility (in blue), both of which were unchanged until they were adjusted upward this week. Moving on to repo market rates, we have the median tri-party repo rate observed by the NY Fed on general Treasury collateral in yellow and the average general Treasury collateral rate observed by DTCC on their GCF repo service in green. For the details of these repo rates are observed and calculated, curious readers can find the tri-party info on the NY Fed’s website and the GCF info from this DTCC booklet. Shown in pink is the rate on a generic 1 month Treasury bill, which is considered a cash equivalent in most cases and represents the Treasury’s liabilities in the short-term money markets. Finally, the white line shows the effective Federal Funds rate, which is the rate at which banks lend reserves to each other overnight on an unsecured basis.
These rates all represent different forms of money dealing activity, where dealing is the act of funding money market assets through money market liabilities. Money dealers seek to arbitrage spreads between rates by issuing their liabilities at a lower rate than the assets they are funding. By deploying their balance sheet to arbitrage spreads, money dealers intermediate in money markets, allowing other participants to access funding and lend their cash smoothly. To understand the mechanics behind these rates, we need to look at five key money dealers: the Fed, the Treasury, the commercial banks, the Federal Home Loan Banks (FHLBs), and the primary dealers. Let’s start with the Fed as the central and most important dealer.
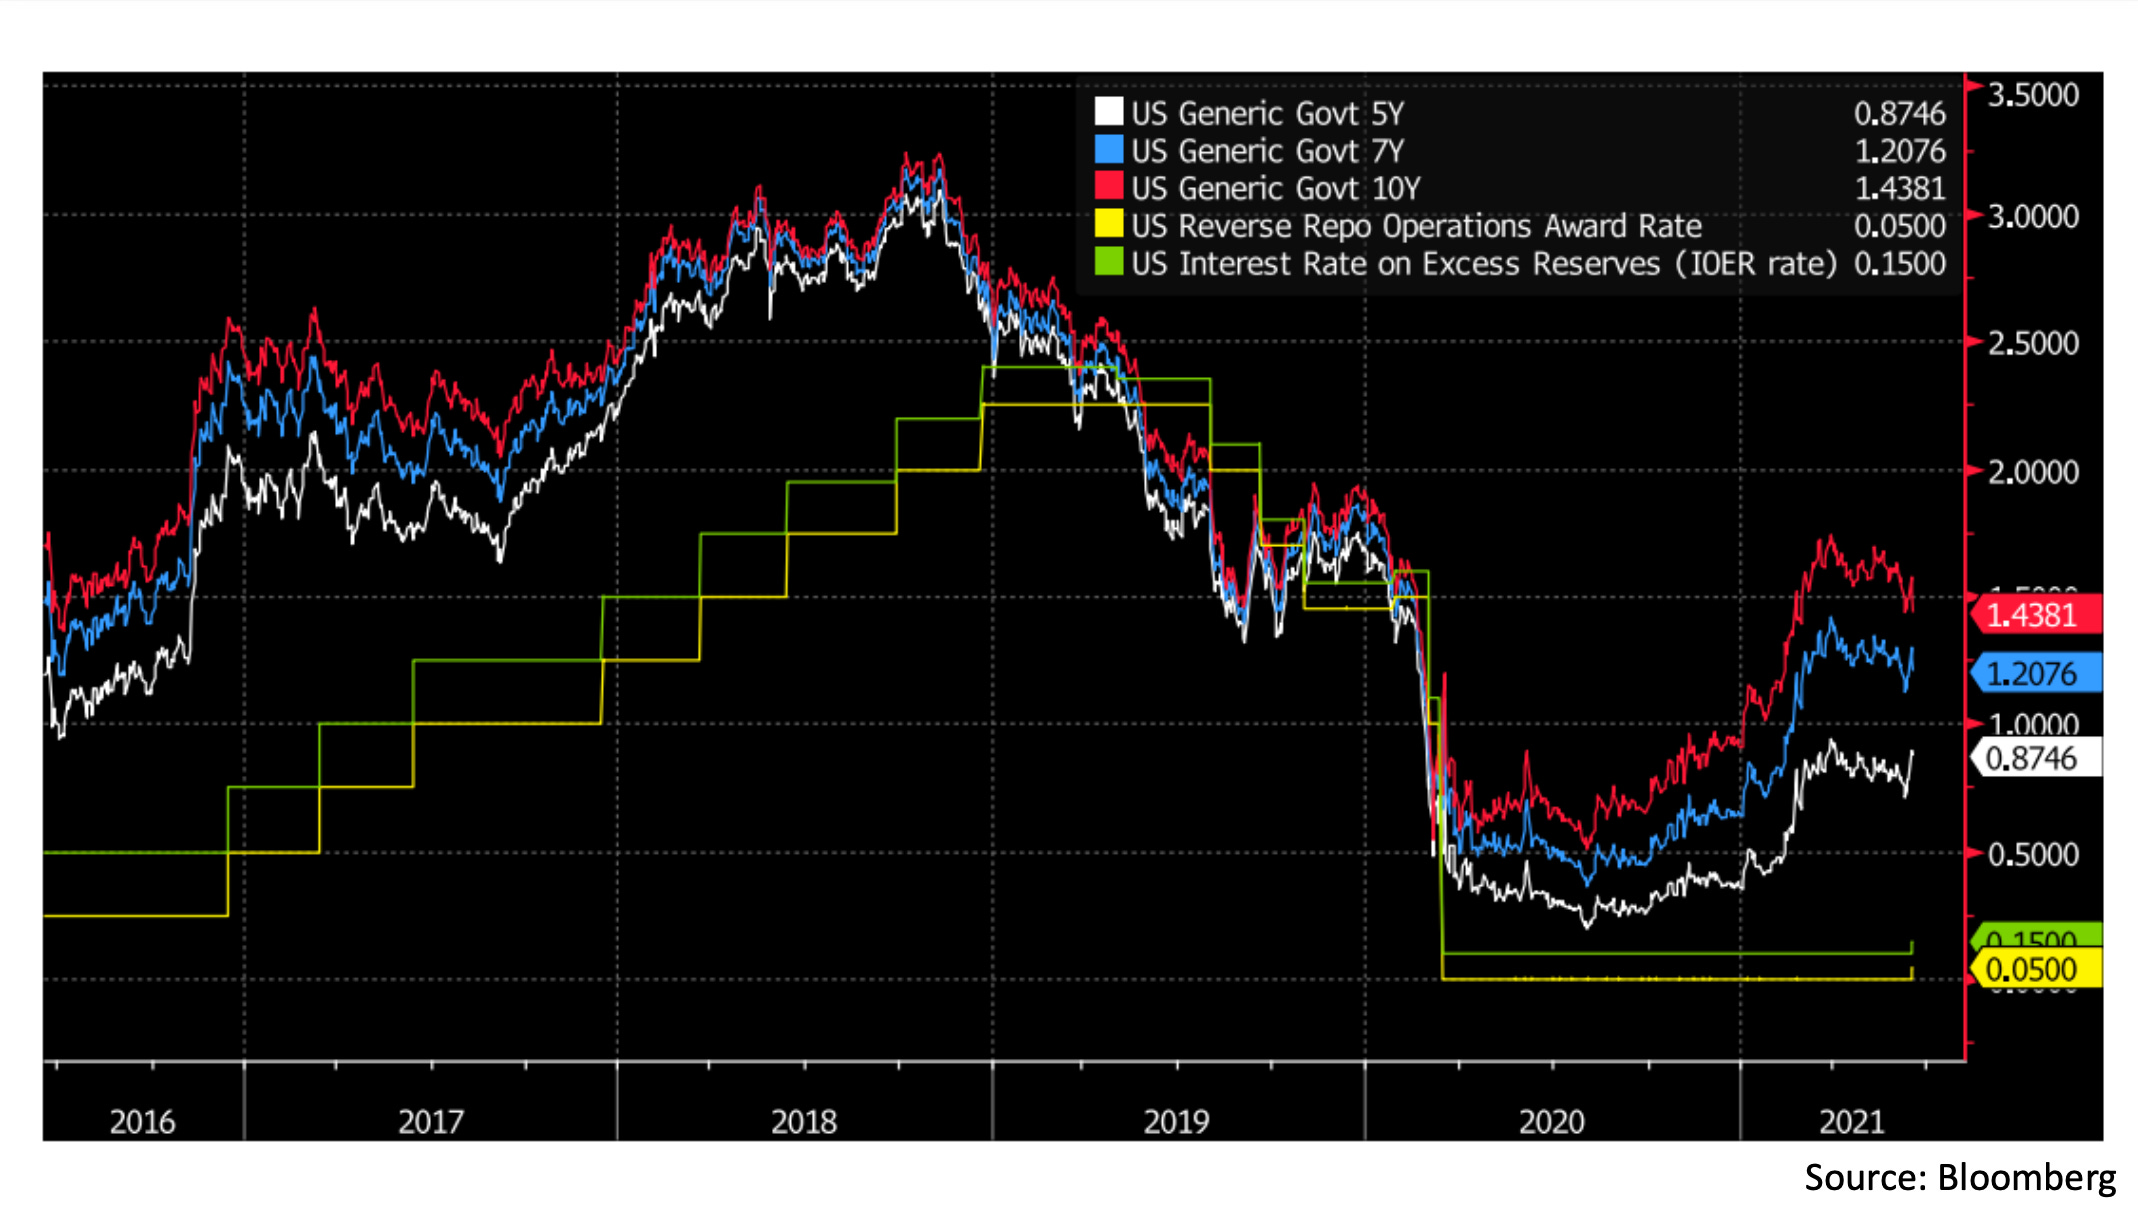
The Fed is different from most money dealers in the sense that the bulk of its assets are longer duration and outside the typical range of money markets. While the Fed does sometimes lend through the discount window and in repo operations, most of its assets are US Treasuries and Agency mortgage backed securities. We can proxy the yield on the Fed’s assets with the yield on medium-term US Treasuries, shown in red, blue and white. The Fed’s liabilities on the other hand, are all cash equivalent. Some of them yield zero, like currency in circulation (physical cash), the Treasury General Account (TGA), and various deposit accounts provided to government entities. Bank reserves, and reverse repos, however, have non-zero yields shown in green and yellow, respectively. Since the Fed’s assets yield more than the weighted average of its liabilities, the Fed is a profitable bank and earns positive net interest income on its balance sheet. The Treasury, on the other hand, earns negative net interest income since it pays interest on debt but does not earn interest on the Treasury General Account. The loss on the Treasury’s money dealing activities is offset indirectly when the Fed pays out most of its net income to the Treasury. To recap, we now understand the red (IOER), blue (reverse repo) and pink (Treasury bill) lines on the first chart. These are, respectively, the rate on Fed liabilities to banks, the rate on Fed liabilities to repo market participants, and the rate on short-term Treasury liabilities to anyone.
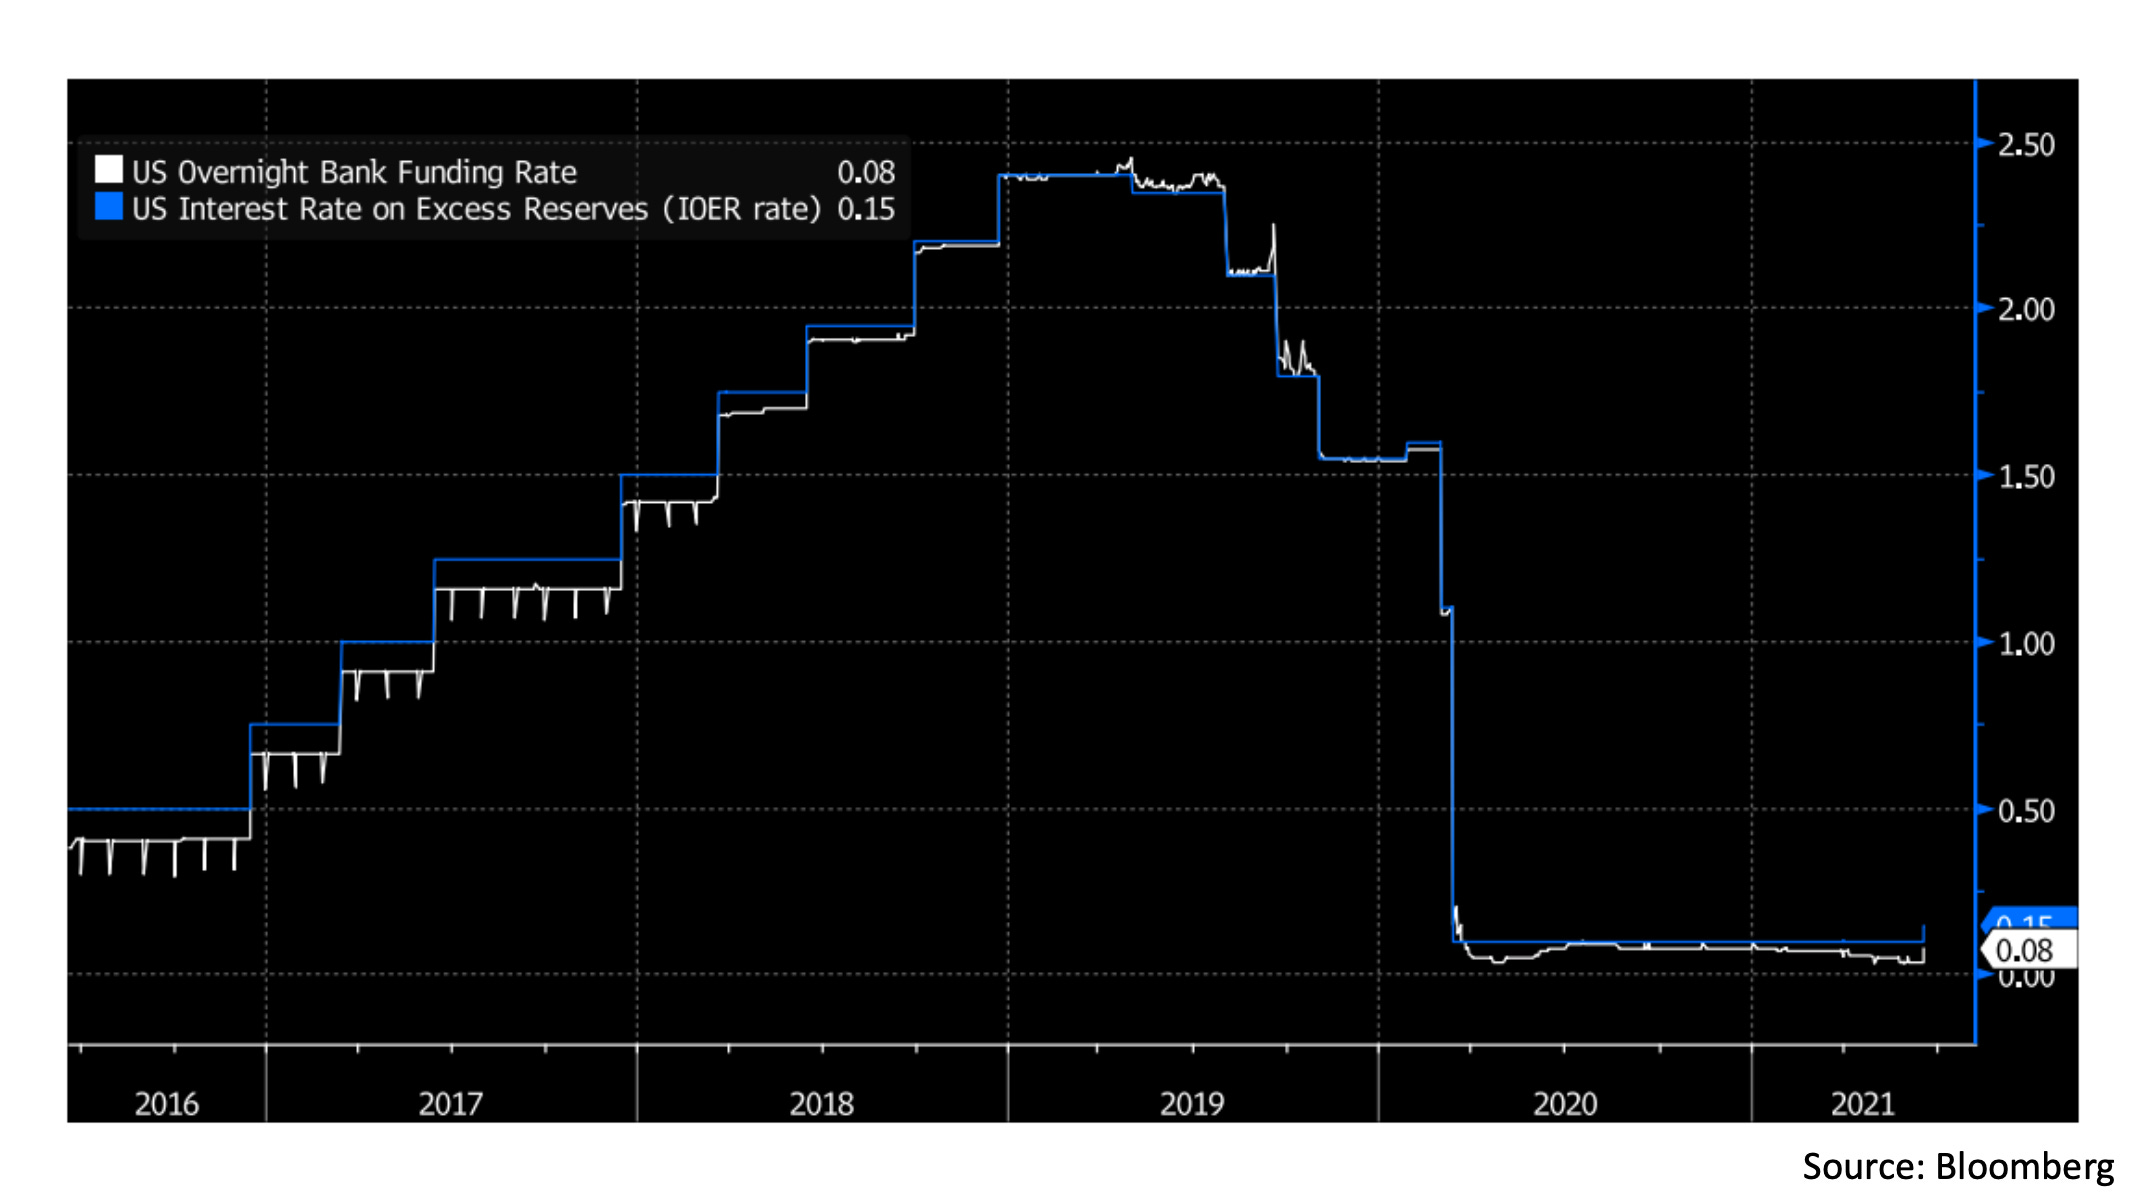
Now let’s move on to the commercial banks. In the post-GFC era, banks are required by Liquidity Coverage Ratio rules (see primer here) to hold sufficient High Quality Liquid Assets (HQLA) to withstand a 30 day period of liquidity stress. Since reserves with the Fed are HQLA, this has led to a market structure in which banks hold abundant reserves earning the IOER rate. This means we can proxy the yield on bank cash assets as the IOER rate shown here in blue. Banks can also borrow reserves overnight at the effective Federal Funds rate or in unsecured Eurodollar markets, which the NY Fed observes to create a composite rate (see details here) on overnight liabilities called the Overnight Bank Funding Rate (OBFR), shown here in white. Since the rate on overnight bank assets is usually higher than the rate on liabilities as we can see from the chart, bank money dealing activities are usually profitable. The reason banks can obtain funding at rates below IOER is that not everyone has access to reserve accounts with the Fed, and some are willing to lend at lower rates.
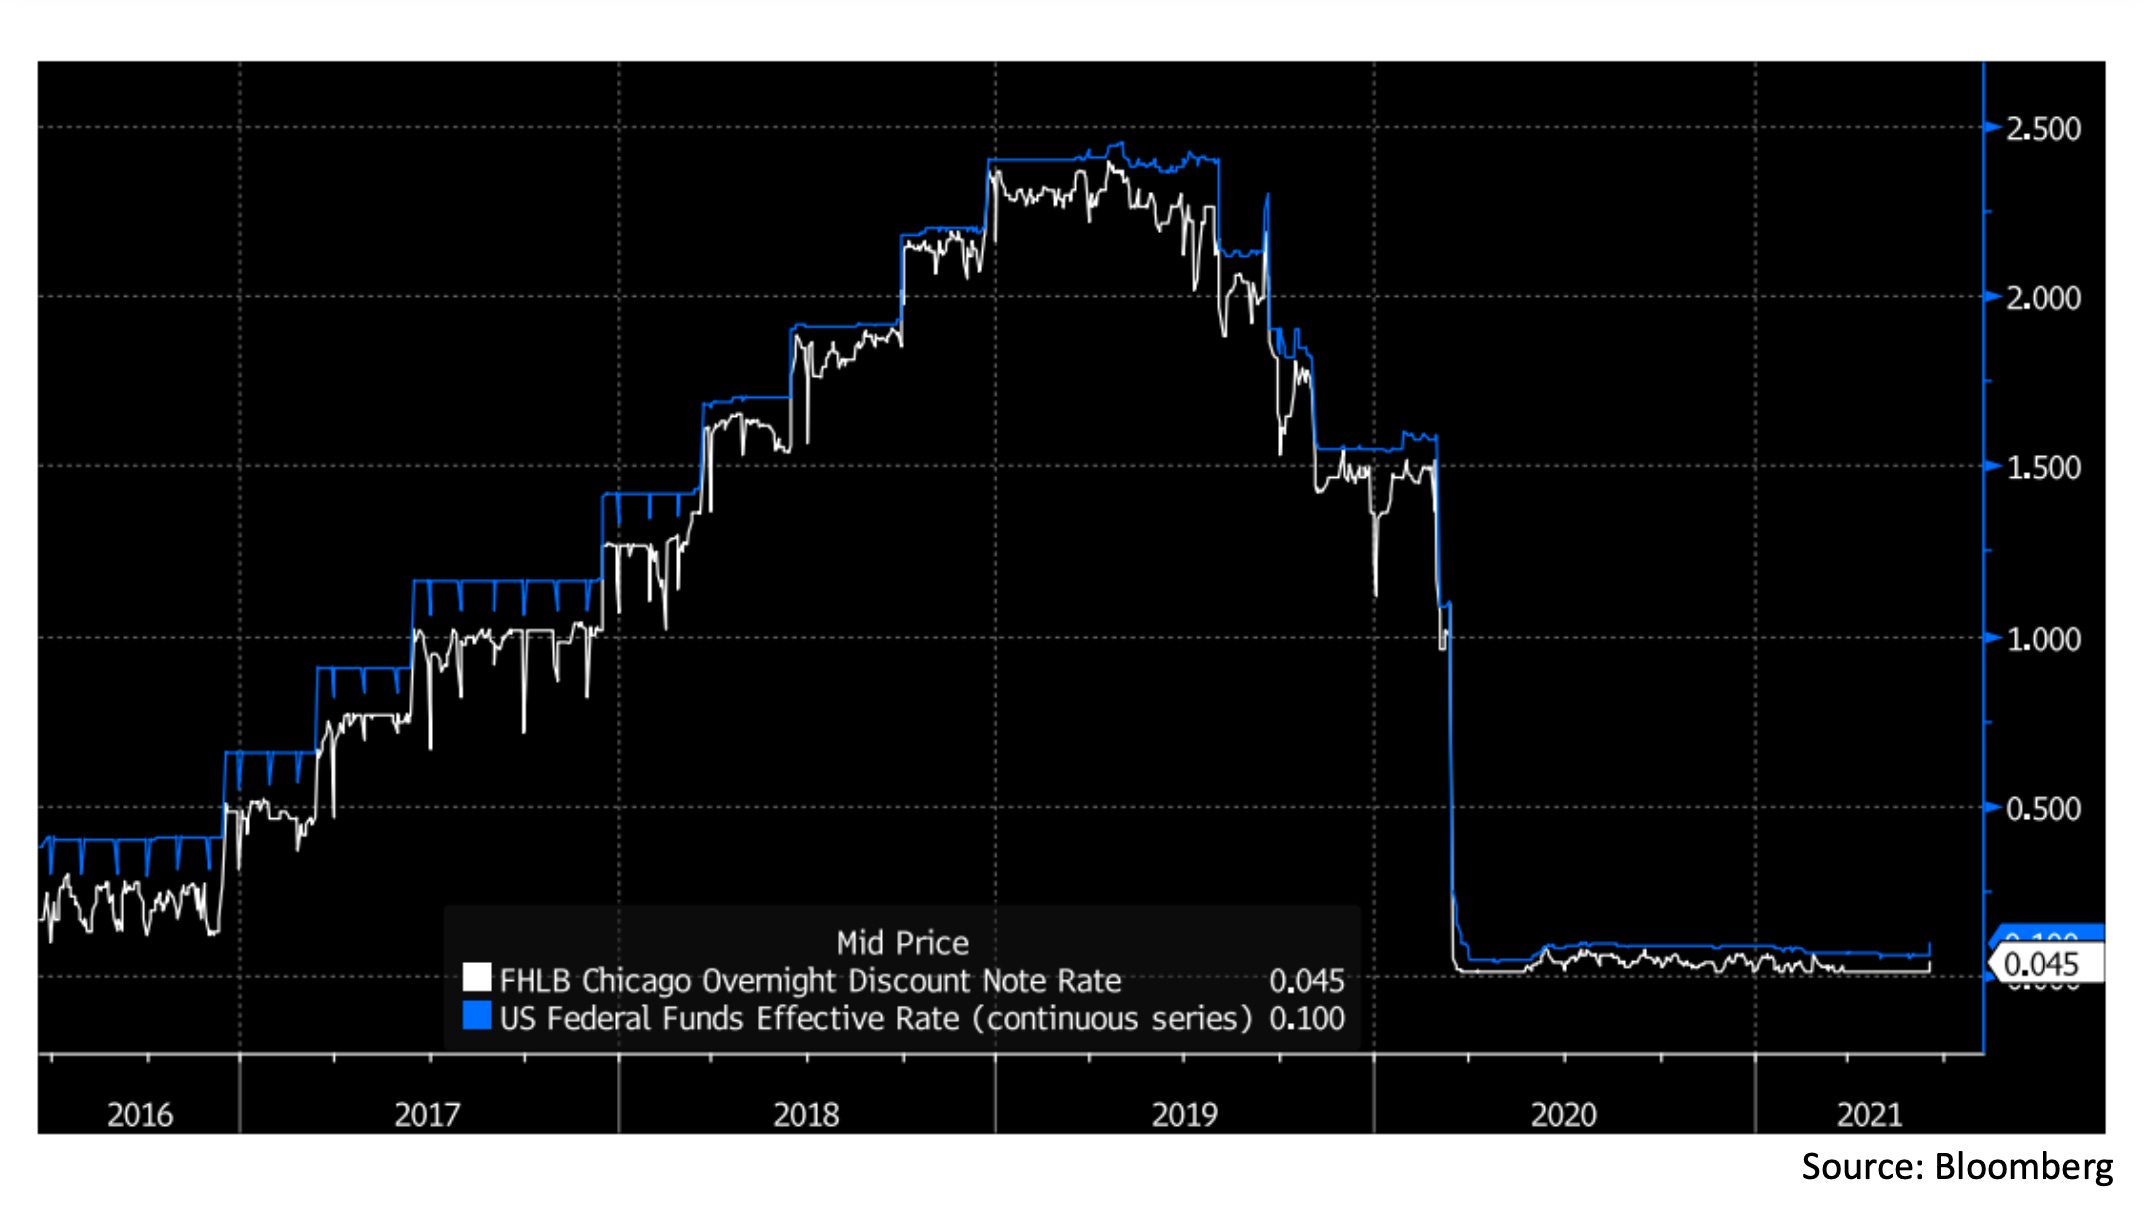
One group that is particularly important in this dynamic are the Federal Home Loan Banks (FHLBs). As government-sponsored enterprises, the FHLBs do not earn interest on reserves, but they do have accounts with the Fed and are able to lend into the Federal Funds market. Since other banks earn interest on their reserves and the FHLBs do not, the FHLBs are the primary lenders in the Federal Funds market. This means we can proxy their yield on money market assets as the Federal Funds rate, shown here in blue. The FHLBs, being government-sponsored and regarded as very low risk, can fund their assets at favorable rates by issuing short term notes at a discount to par, which serve as close analogues to Treasury bills. Shown in white on the chart is the rate on overnight discount notes issued by the FHLB of Chicago. Since the rate on overnight FHLB liabilities is usually lower than the effective Federal Funds rate, they can also profit from short-term money dealing. To summarize this part, we have seen how the commercial banks and FHLBs intermediate the spreads between IOER and the Federal Funds rate, and the Federal Funds rate and FHLB discount notes, respectively.
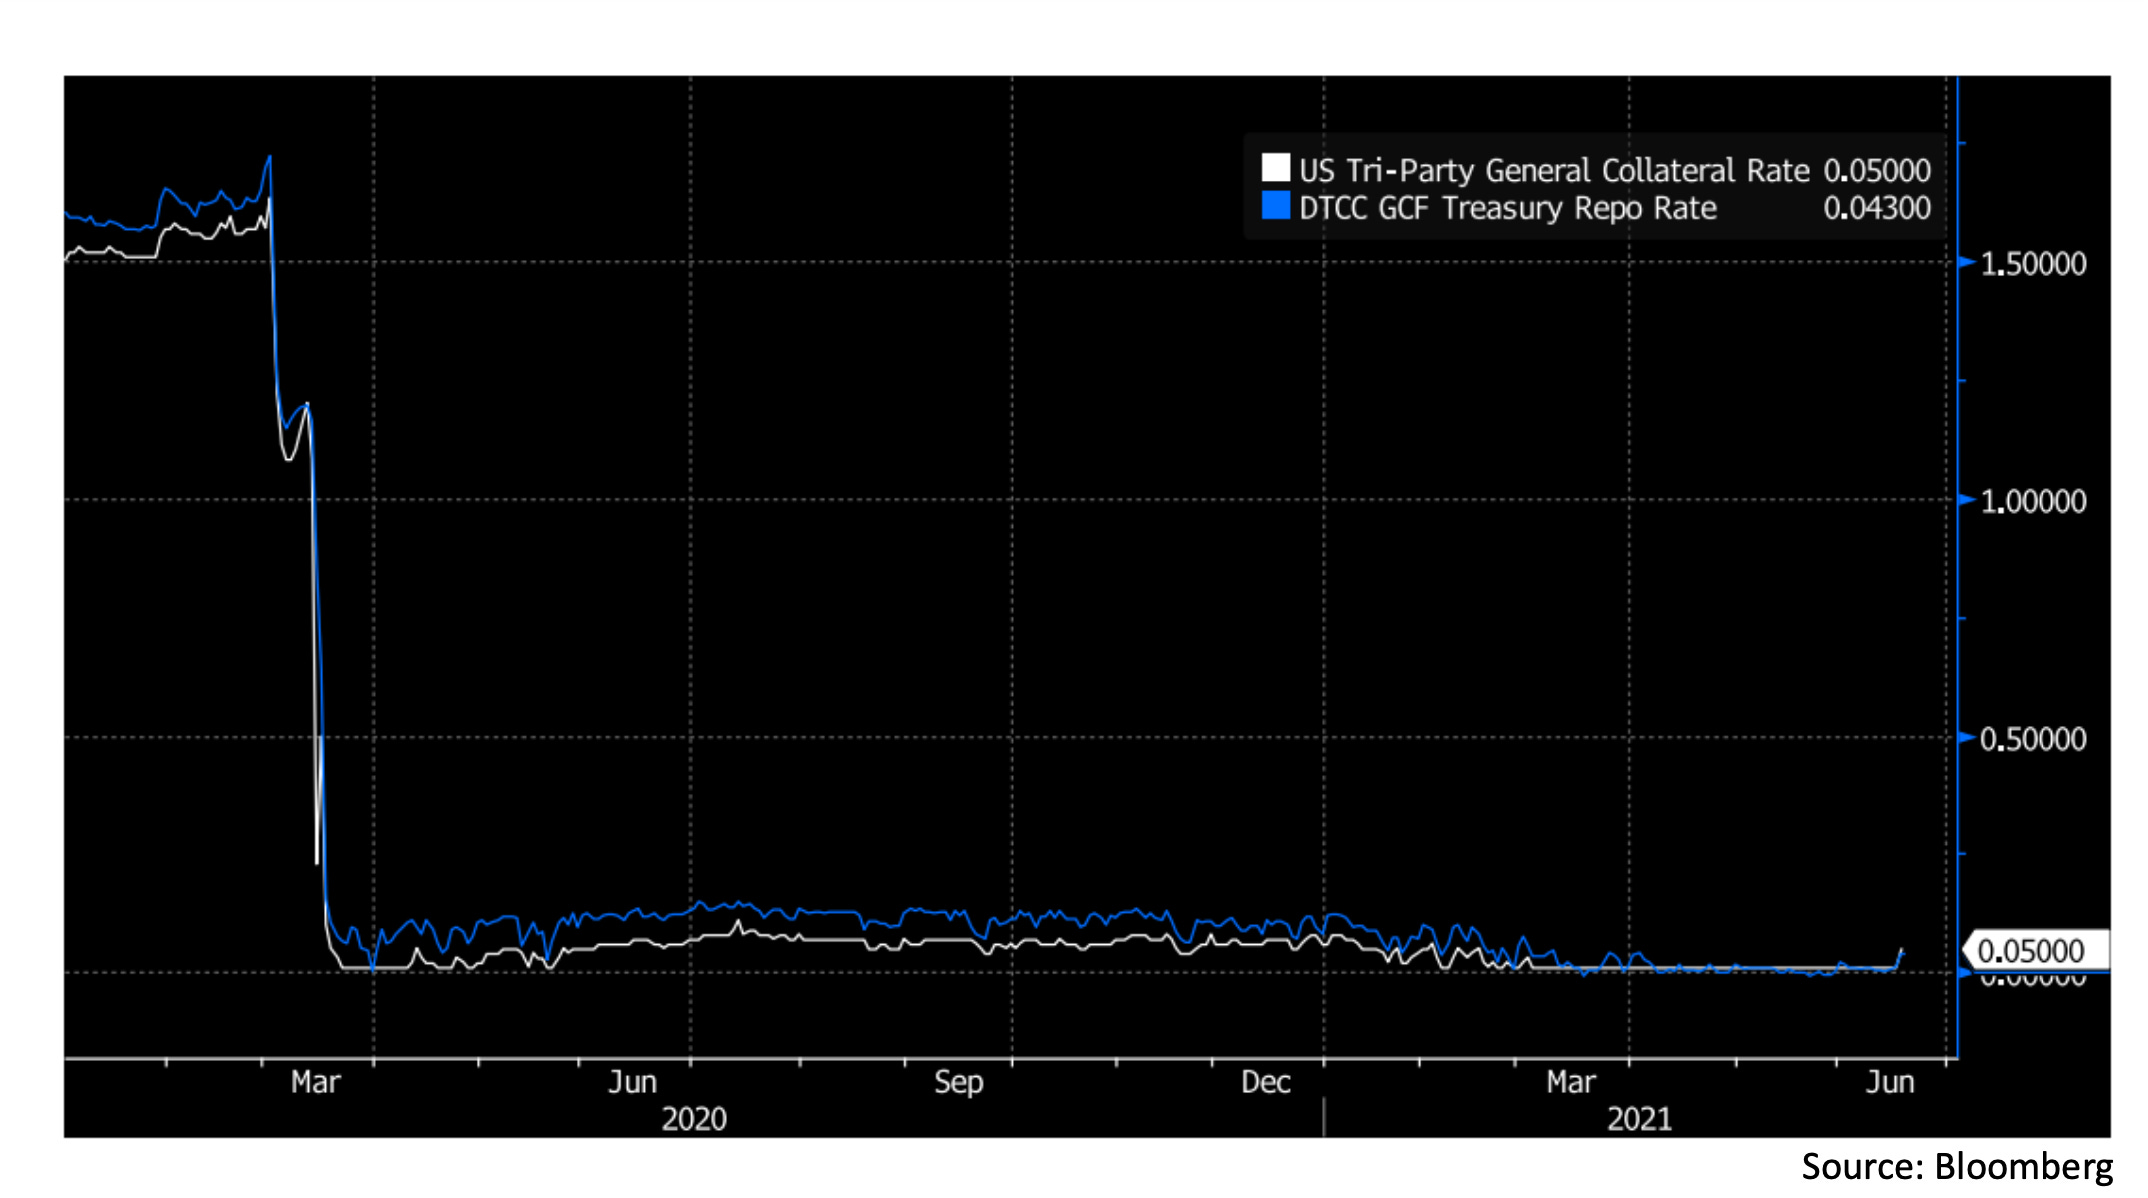
Now let’s move on to the repo market. We have already seen how the Fed offers a floor to rates in the Treasury repo market through its overnight reverse repo facility. Since the Fed is the lowest-risk counterparty in the market, repo lenders with access to the Fed should be unwilling to lend below the offered rate. Usually, this keeps repo rates above the rate offered by the Fed, though market frictions sometimes cause minor ‘leaks’ in this floor. Another floor for overnight repo rates is the rate on the shortest-term Treasury bills, since repo lenders could choose to hold them as cash equivalents instead of lending into the repo market at lower rates. This fungibility between Treasury bills, Fed reverse repos, and the broader repo market is not perfect, but for the most part serves to control the lower end of the range in market repo and Treasury bill rates. On the other side of the range, repo rates have a ‘soft’ ceiling imposed by IOER, since at above that rate the banks would find it advantageous to mobilize their abundant reserves in the repo market. The key intermediators in the repo market are the primary dealers, who lend to other dealers (both primary and non-primary) through the DTCC’s GCF repo service at the rate shown in blue (and to non-dealer clients at slightly higher bilateral rates). This makes up the asset side of primary dealer’s matched repo books, with the liabilities side usually in the tri-party repo market (rate shown in white). Since the GCF rate is usually higher than the tri-party repo rate, this means that primary dealers are usually also profitable in their money dealing activities.
Now that we’ve looked at the main parties involved in these short-term rates markets, let’s consider what happened when the Fed raised IOER and reverse repo offered rates by 5 basis points this week. The change in reverse repo rates provided an attractive alternative to repo market participants such as money market funds, causing rates on their other assets, such as repos, Treasury bills, and close analogues like FHLB discount notes to rise. On the other side, the increase in IOER allowed banks to pay the FHLBs a higher rate in the Federal Funds market, shifting the Federal Funds rate up by about 5 basis points as well. Over the next few weeks, we will probably see some adjustment as market participants move to wherever available offered rates are highest (for example, from bank deposits to money market funds) and rates may shift around somewhat as a result. For now though, the Fed has successfully lifted the US overnight rates complex a few basis points off the zero lower bound with its latest rate adjustment.
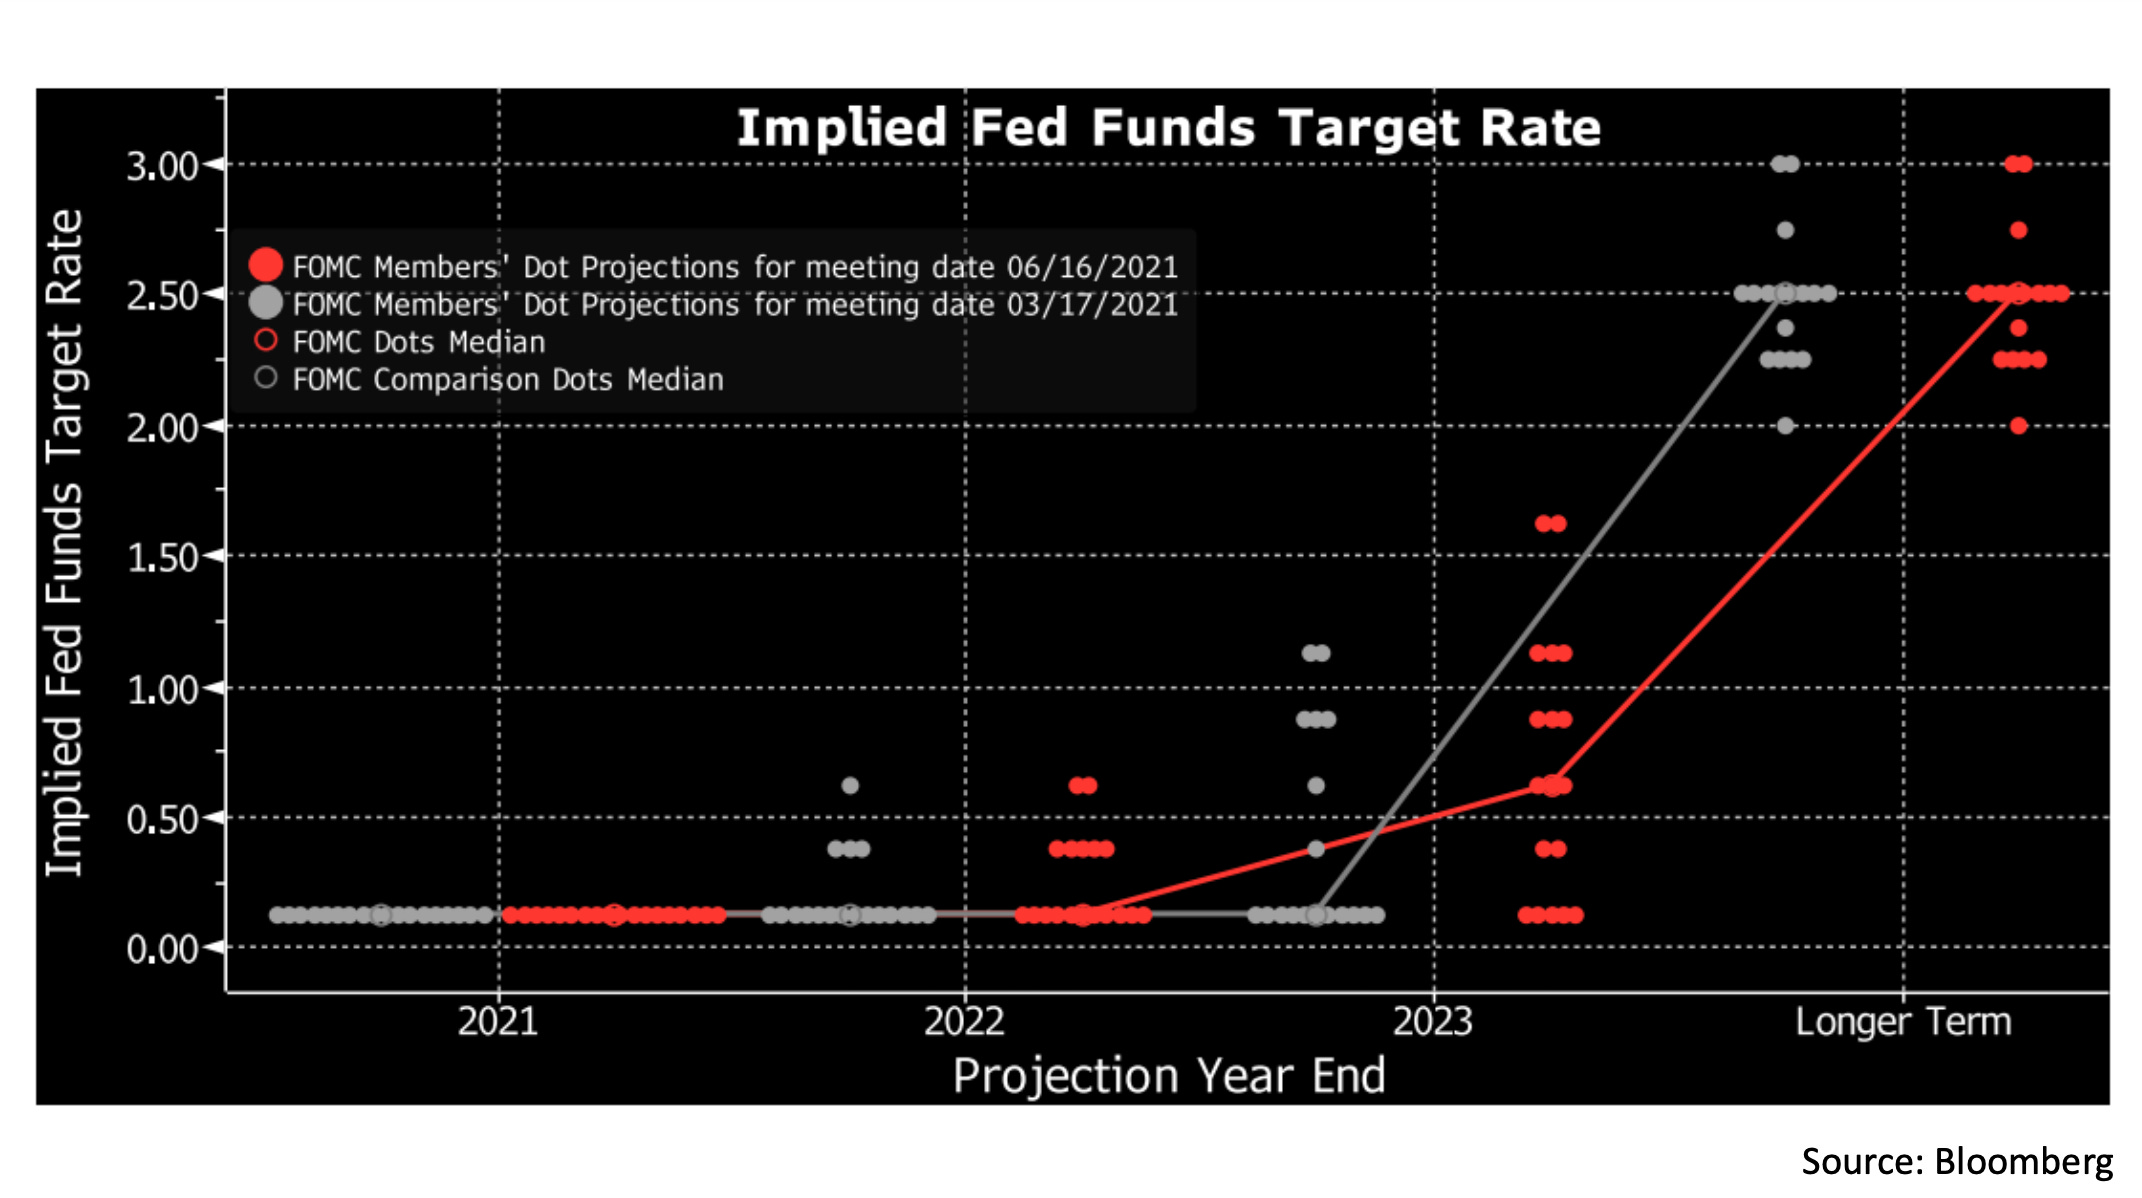
Another key point of this week’s Fed announcement was a slight change in forward guidance for short-term rates in the future. Every few months, the Fed releases a chart showing the projections of FOMC members for future target rates (see page 4 here for the latest, and page 4 here for the March 2021 projection). These are usually displayed in the form of a dot plot, with each dot representing one FOMC member projection. While in March a few FOMC members projected rate hikes in 2022 and 2023 (grey dots), the new release saw more joining the rate hikes camp (red dots), with the median member now projecting rate hikes before the end of 2023. This had an immediate effect on interest rate futures, which moved to price in the shift in expectations to a sooner hiking cycle.
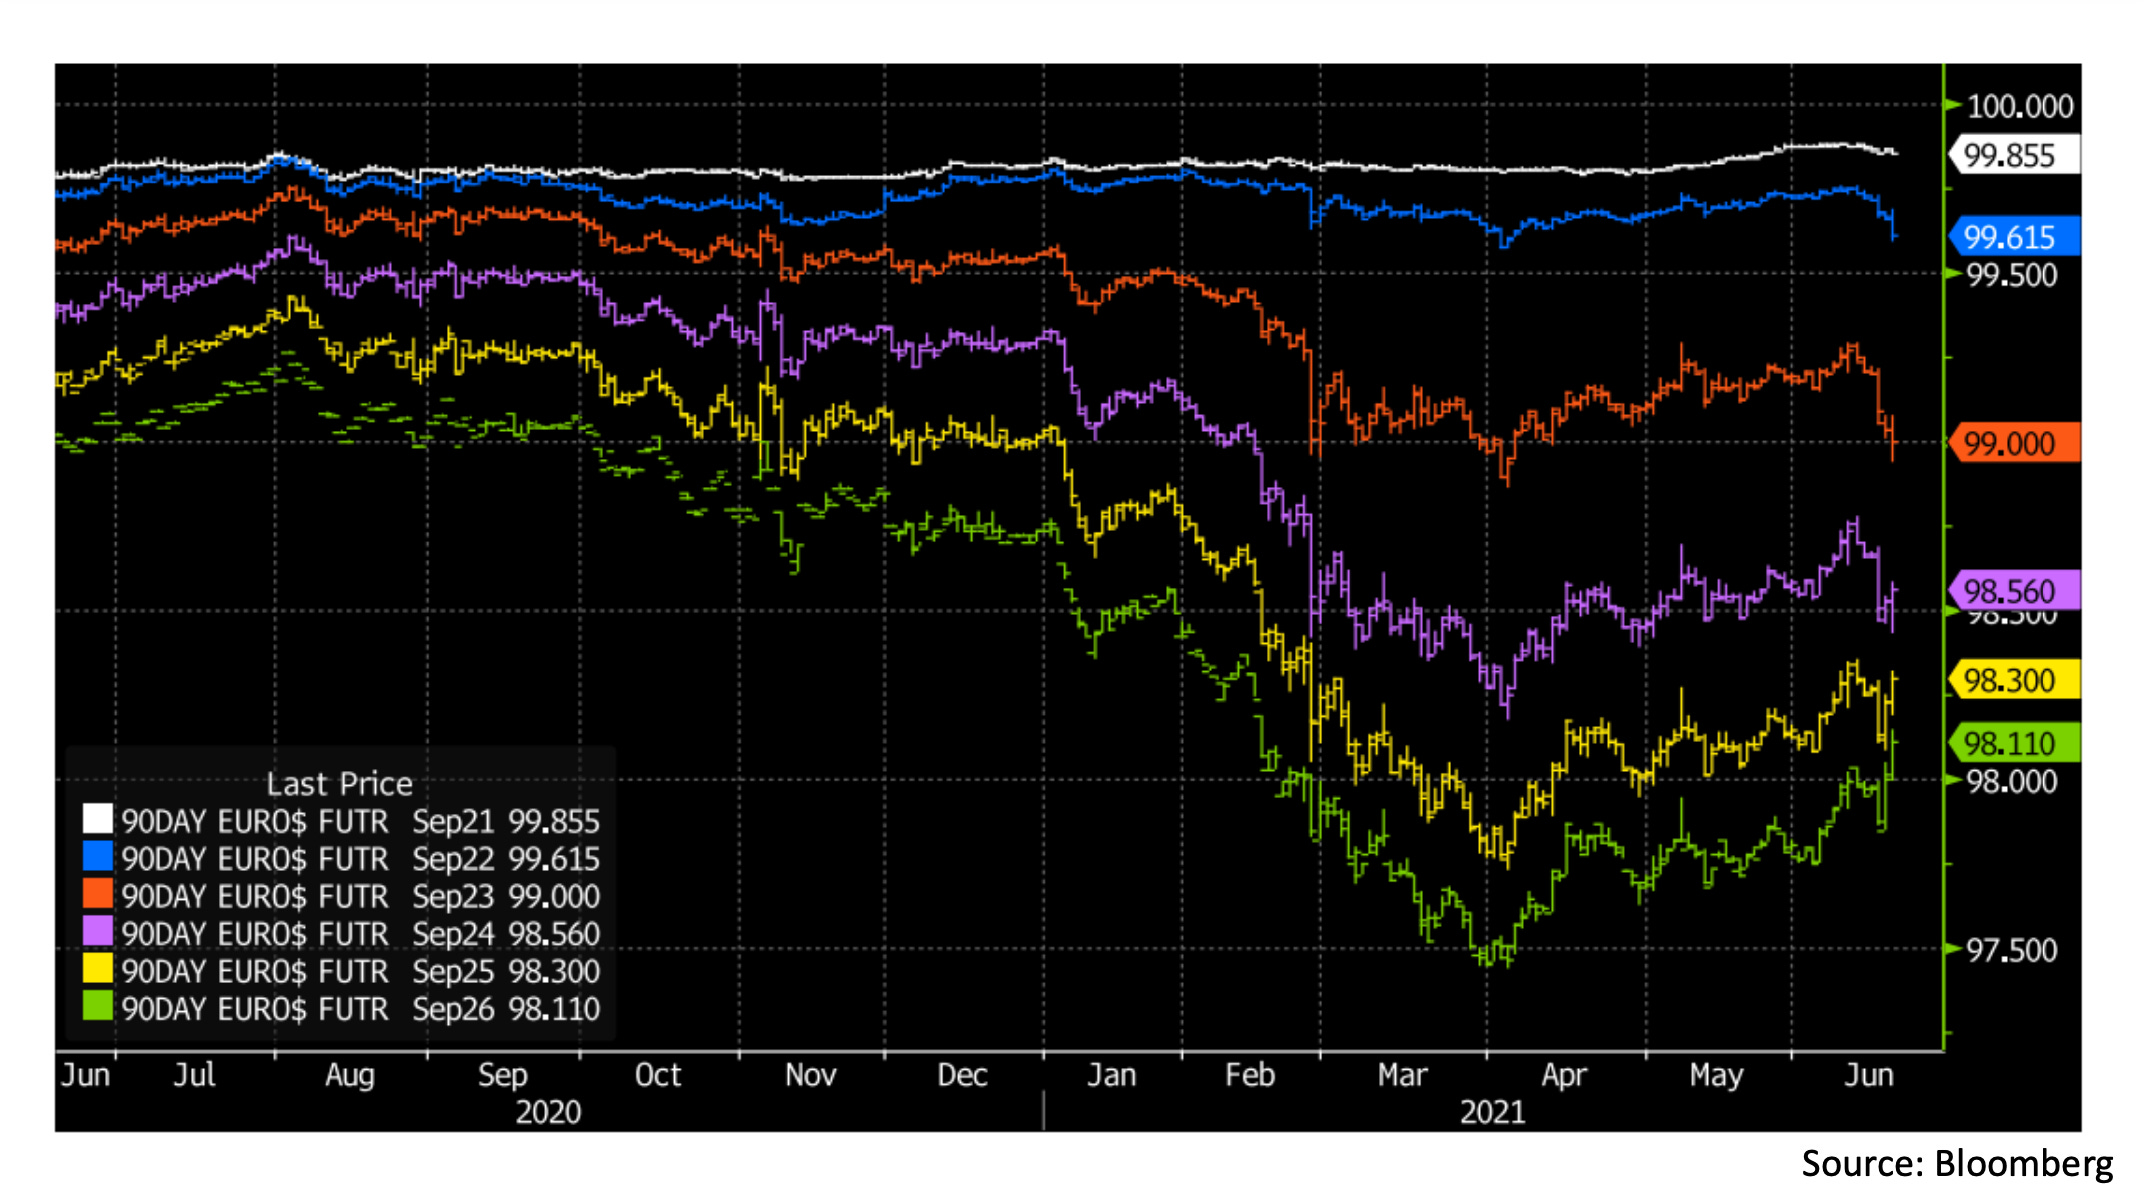
In this chart we see the September Eurodollar futures for the years 2021 through 2026, which price inversely to the expected 3 month Libor rate at the contract date (for example, the September 2023 futures at $99.00 is pricing a rate of exactly 1%). The futures through 2024 traded lower on the Fed’s announcement, understandably pricing in rates rising sooner (blue, red, and purple lines). However the 2025 and 2026 futures rallied after an initial drop (yellow and green lines), somewhat counterintuitively pricing in lower rates in those years.
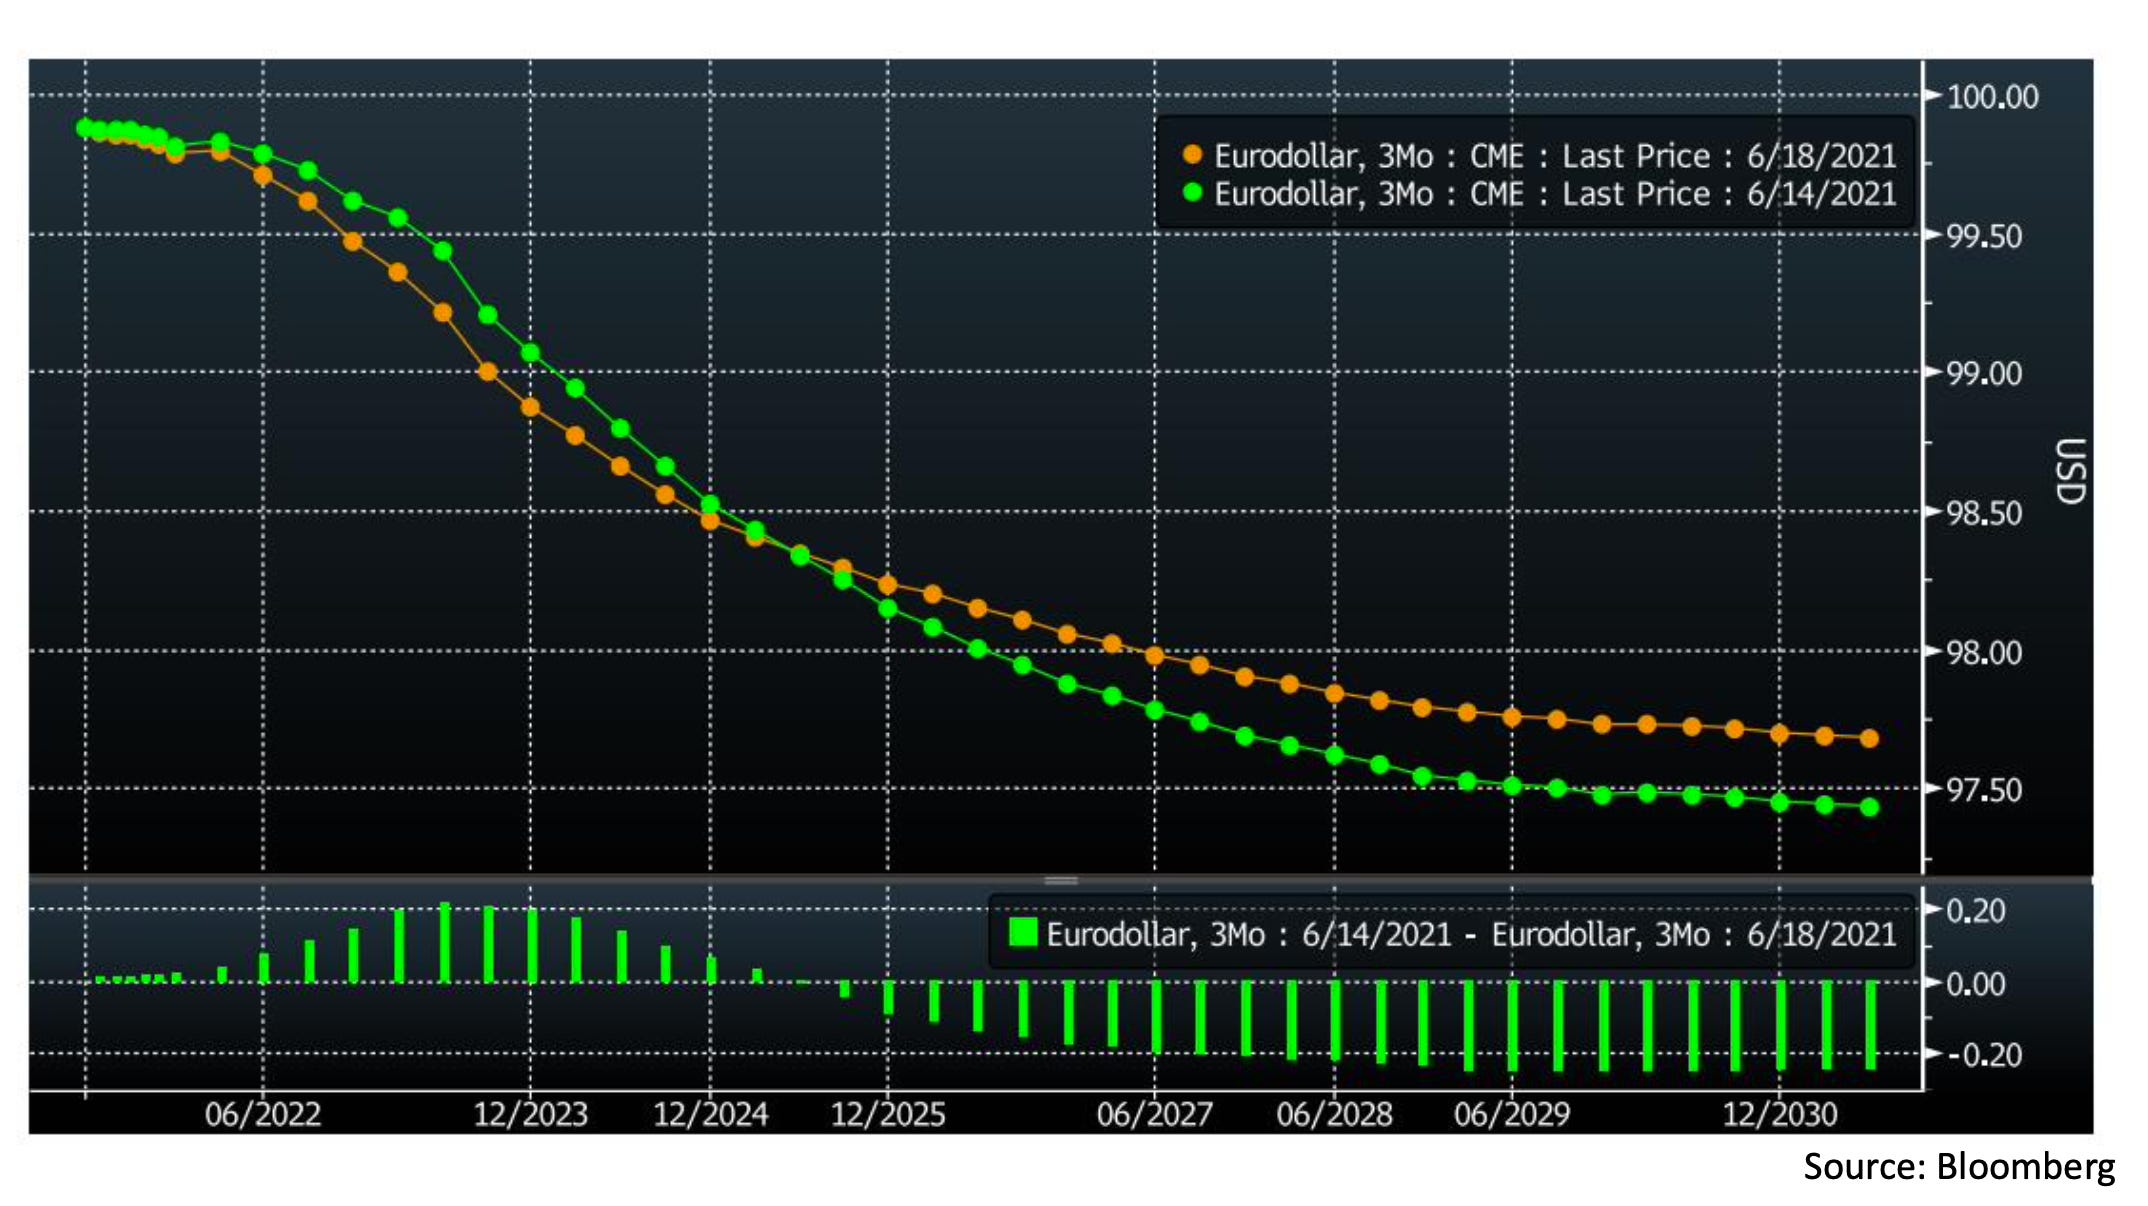
Looking at the all the active Eurodollar contracts as a curve, we see that between Monday June 14 (green) and Friday June 18 (orange) the curve twisted, rising past the March 2025 point and falling in the longer term contracts. The green bars below tell us the change in expected rates, where we see a rise of up to 20 basis points in 2023 and a fall of up to 20 basis points in 2027 and later. This suggests that the market is pricing in a sooner but shorter Fed hiking cycle, with the rate hikes coming earlier but also not going as high as previously expected.
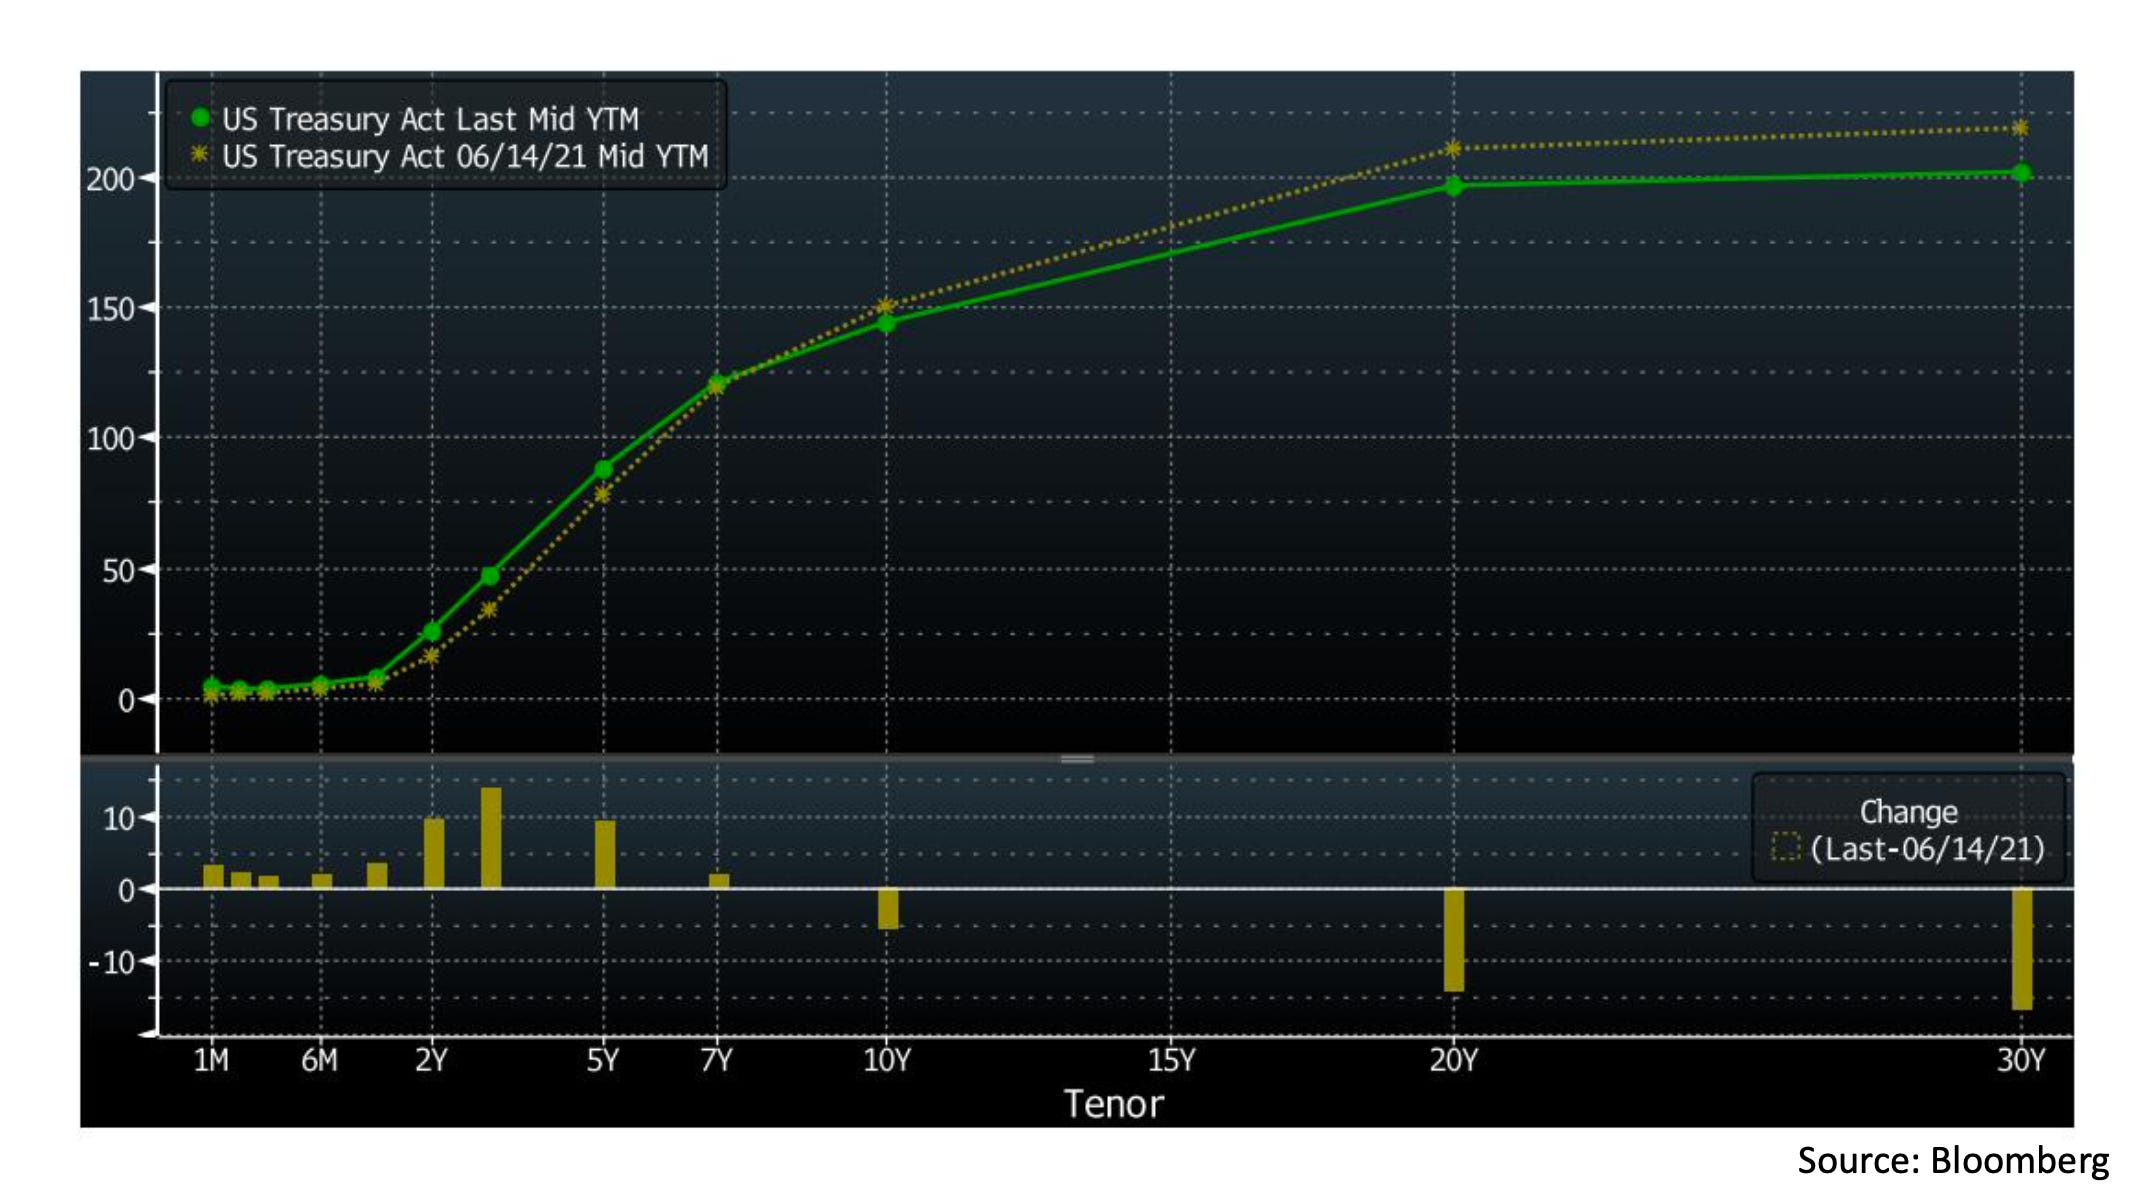
Finally turning to the Treasury market, we also saw a few notable shifts from the start of this week. This chart shows the US Treasury curve on Monday (brown) and Friday (green), with the lower panel showing the change in yields in basis points. In the shortest term maturities we see that Treasury bills shifted up by a few basis points, as a direct consequence of the earlier discussed money market rate adjustment. In the longer term maturities however, we saw the shift in expectations to a faster Fed policy cycle be priced in as a flatter curve. The 2 year through 5 year maturities saw a notable shift upward in yield, while yields fell sharply in the 10 year, 20 year, and 30 year maturities. Though some of this move may have been a result of steepener positions being liquidated, there is a rational case to be made that if Fed policy does indeed shift to a faster cycle a flatter yield curve is warranted. This would be because a more sensitive Fed reaction function cuts off tail scenarios, which would be reflected in a lower term premium for holding longer duration bonds.
That is all for this week! Thanks for reading if you made it all the way to the end and hope to see you back again soon for another Chartbook :)
Cheers,
DC
Fantastic! For each chartbook you post, I learn a lot more about us money market.
If possible, write about capital requirements and their impacts on those rates and FX market.
Thanks!
This is fantastic, thanks. Flattening yield curve at the slightest hint of an attempt to raise rates from near-zero levels! Isn't this the market telling the Fed it doesn't believe the Fed can pull off more than a couple of tiny rates hikes (if at all)? If I was a policy maker I would be very worried by this market reaction, since it means I have lost control or credibility or both.