
Chartbook #10
May 31, 2021

Hello everyone and welcome back! This week’s Chartbook will focus mostly on US Treasury Bills and other low-risk money market assets. The recent drop in Treasury Bill yields to almost zero out to the 1 year point has driven some usual holders to seek alternative cash equivalents. While one of these alternatives, the Fed’s reverse repo operations, has risen greatly in usage and captured the attention of the broader financial world, relatively few market participants have access this facility. This Chartbook will look at the options available to participants without direct access to the Fed, such as corporate and institutional treasuries, and the impact their footprint is having in some areas of the market.
To start, let’s consider why Treasury Bills are becoming a something of a scarce commodity lately. In the spring and summer of 2020, the US Treasury issued a large amount of bills (about $2.5T net) to fund emergency spending and build up the Treasury General Account (TGA). Since the issuance was concentrated in near-cash securities, a portion of it has been warehoused by money market funds, corporate treasuries and foreign official institutions since last year. However, now these Bills are maturing at a fast pace, and as part of standard debt management strategy the Treasury prefers to replace them with longer term Notes and Bonds versus continuing to roll them forward.

These tables show the two latest Treasury Monthly Statements on the Public Debt (posted here), which illustrate this shift in the Treasury’s debt structure. In the month of April the marketable supply of Treasury Bills shrunk by about $129B, while longer maturity debt rose to offset this. To see what happened in May, we can turn to the latest Daily Treasury Statement for May 27 (posted here).

This table shows that in May the Treasury has continued to shrink Bill supply, with new issuance of $1.18T only partly offsetting the $1.34T maturing. With another $163B of supply taken off the market in May through the 27th, the cumulative total for Q2 through that day amounts to about $292B in net Bill redemptions. Combined with new inflows from the TGA draining simultaneously, it is not very surprising that money market funds have sought the Fed reverse repo facility as an alternative in high volume. Though the pressure from the TGA will likely fade over time and the Treasury may ease Bill redemptions (only $247B of Bills were initially projected to roll off in the entirety of Q2, see here), we are currently in an environment were demand for Bills is high and supply is shrinking.

In this chart we see the effects of the environment on Bill yields, with shorter term yields going to zero first and longer term yields grinding steadily lower, eventually driving the entire Bill universe below 4 basis points of yield. Now, let’s consider what a corporate or institutional treasury can do faced with Bills maturing and falling yields. The natural choice would be for companies and institutions to simply keep cash as bank deposits if alternatives are unavailable, but recent surveys of bank officials suggest some are taking steps to push away deposits for balance sheet management reasons (see Question 3A on page 12 here). To understand how these market participants react to such pressures, it is useful to consider that they usually have a three part mandate:
Hedge FX risks
Borrow cash at the lowest available rate if needed
Lend excess cash at the highest available rate in near-cash instruments
If a materially positive yield for part 3 of this mandate cannot be achieved through nominally minimum-risk investments like Treasury Bills, money market funds, or bank deposits, corporate treasurers can take a small amount of credit risk in search of a higher yield, such as by buying a certificate of deposit (CD) or commercial paper.

This chart shows the yields of some common low-risk alternatives (multi-color lines) compared to 6 month and 12 month Treasury Bills (blue and white lines, respectively). These alternatives include US commercial paper, offshore “Eurodollar” commercial paper, and US dollar CDs offered by a European bank (called Yankee CDs). We see that yields on these alternatives have also been falling. While it was possible to earn 15-25 basis points at the start of the year depending on how much risk one was willing to take, the highest available yield now is only 16 basis points (on 1 year offshore commercial paper, which exceeds the maximum maturity typically issued in the US).
Faced with low yields in conventional alternatives, corporate treasurers can turn to the FX market in search of a place to lend their dollars against other currencies at a higher yield. While in an arbitrage-free world the shortfall or excess yield earned by lending dollars against another currency would be exactly offset by the yield differential between the two currencies (a principle called Covered Interest Parity), this is not the case in reality. Arbitraging dislocations created by global capital flows and local changes in supply and demand of currency requires a tremendous amount of balance sheet capacity, which in the post-2008 world is not available for this kind of activity. This means that persistent opportunities to earn excess yield in the FX swaps or forwards market do exist (see BIS paper here for some good background).
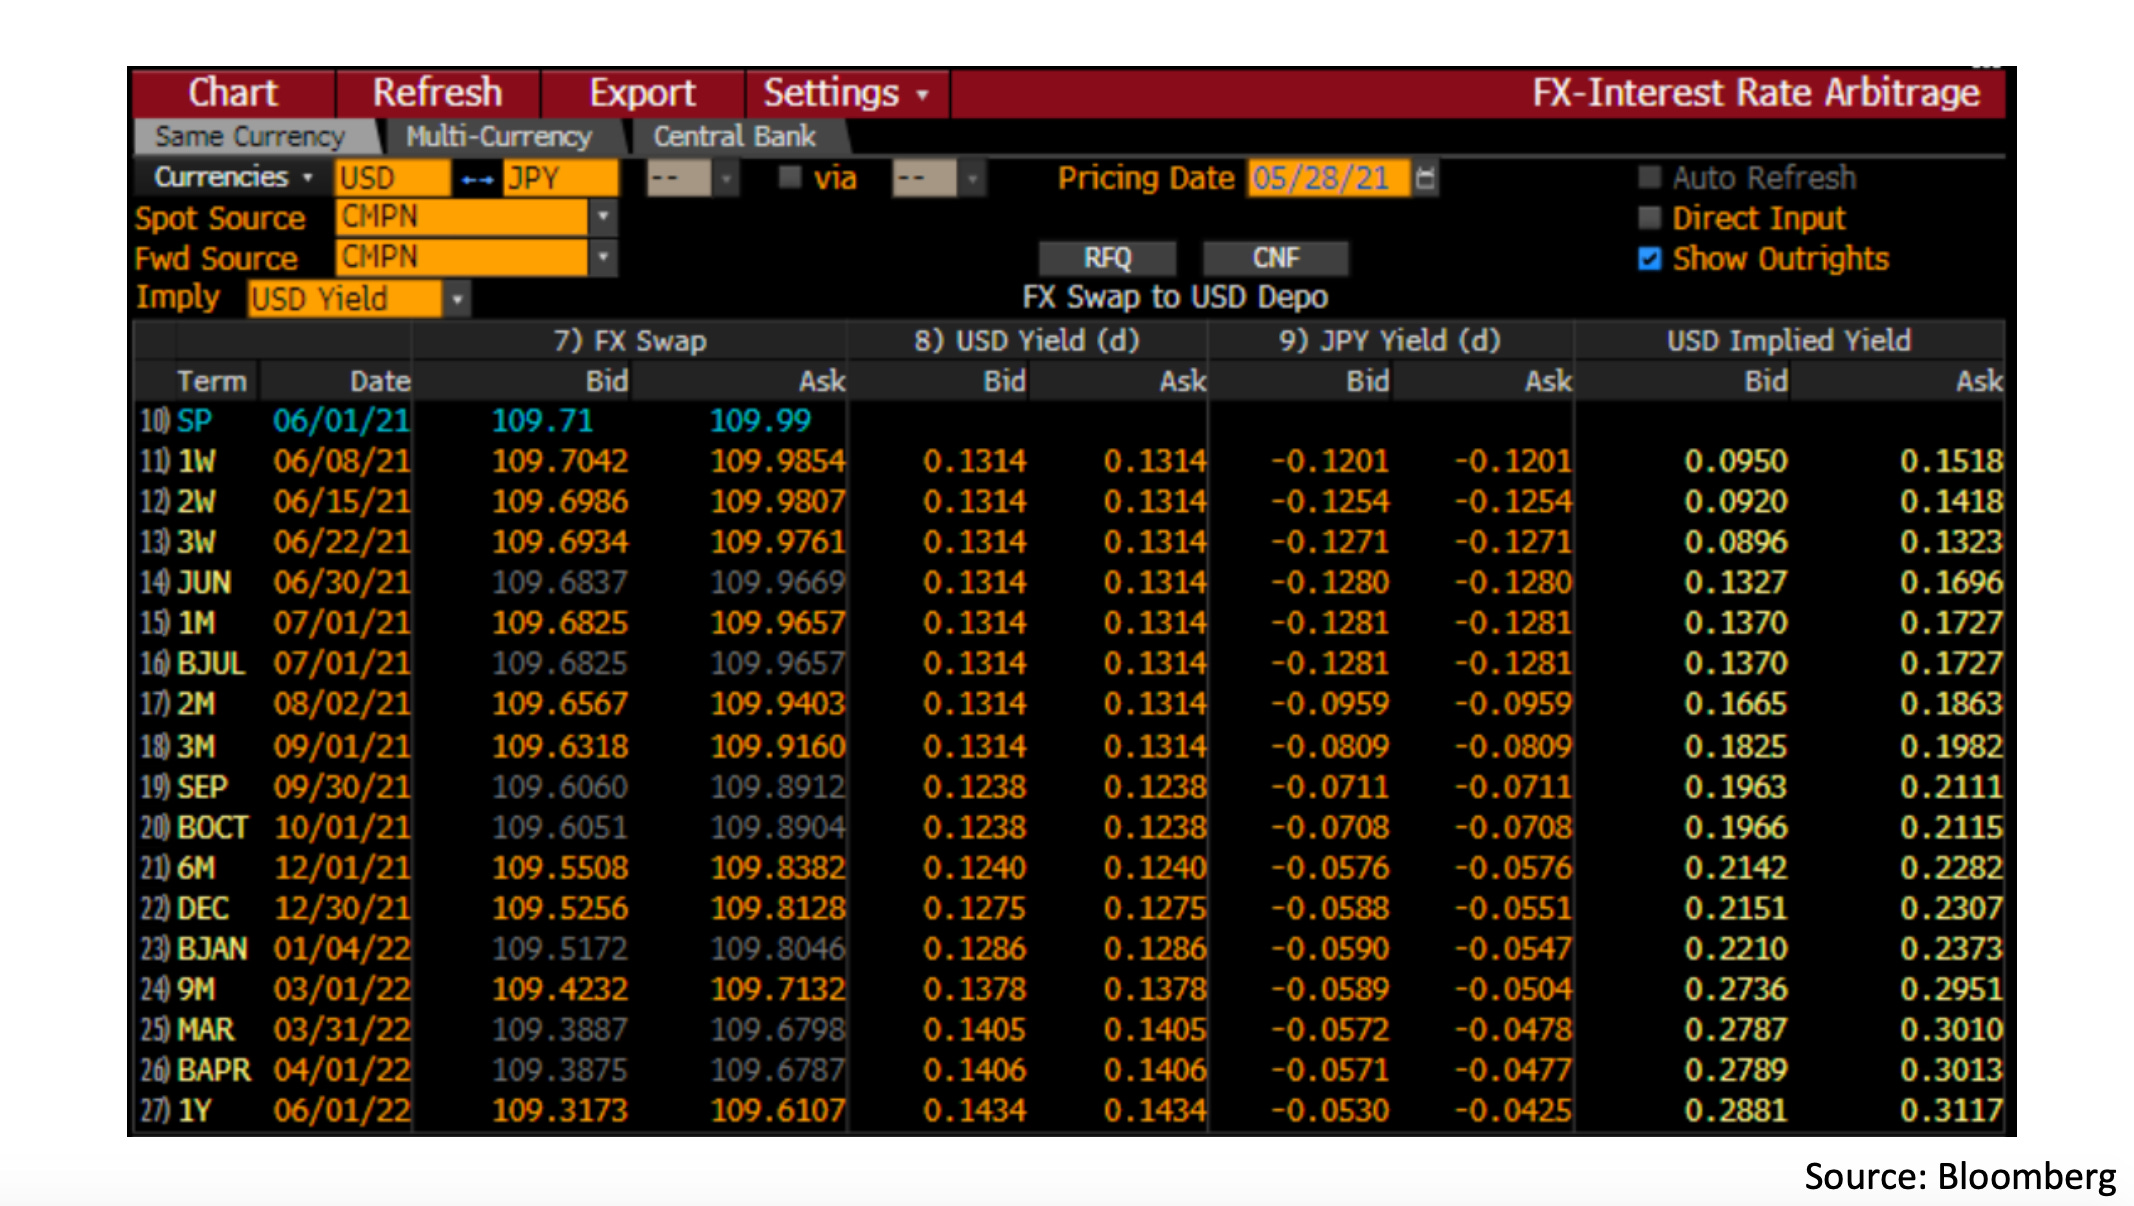
This table shows a series of quotes for USDJPY forward rate of different term on May 28 as would be seen by a corporate treasurer looking for yield. The first row (labeled SP) tells us the spot exchange rate for this FX pair and the values in the first column below that tell us the forward exchange rates across the various maturities. The next two columns (labelled USD Yield and JPY Yield) are the estimated deposit rates in each currency, here proxied by the Libor swaps curve. The final column (labeled USD Implied Yield) gives us the yield earned by selling USD at the spot price and buying it back in a forward transaction in an FX swap, while holding a JPY deposit in the interim.

If a corporate treasurer plotted these quotes over the past few months to see how much excess yield they are earning, it would likely look something like the chart above. The red lines here show the estimated USD deposit rates from the Libor swaps curve, the blue lines show the implied USD yield from a USDJPY FX swap, and the dotted lines show the historical data from the beginning of February. While a few months ago a treasury could earn excess yield at any maturity from 1 week to 1 year (increasing for the longer maturities) this is no longer the case. Now for transactions of less than 1 month term, a USD lender would be sacrificing yield relative to USD Libor by lending through a USDJPY swap. Of course, treasurers may not have access to deposits yielding USD Libor and may still find this to be a good deal, or they may reach further out the curve into the longer maturities, but it is clear that opportunities here are shrinking, so let’s look at another major currency.

Making the same chart for USDEUR swaps shows a similar picture. Though some excess yield relative to the Libor curve is available for all maturities, it is also shrinking and now below 5 basis points out to the 1 year point. To summarize these effects, a corporate treasurer might plot the excess yield available in various currencies over time, which may look like the chart below.

Here we see the excess yield available for lending dollars in JPY swaps (black lines) and EUR swaps (orange lines) in February (dotted) and today. From this we can see that the longer end of the JPY curve has become one of the few places where significant excess yield still remains. Elsewhere, most of the excess yield has been eroded by USD near-cash investors reaching for alternatives in recent months. This trend is also shown in EUR and JPY basis spreads, which tell us the deviation from Covered Interest Parity observed in Libor-indexed swap transactions (mostly by financial institutions) across these currency pairs.

From this chart we see the excess yield available in 3 month basis swap transactions indexed against 3 month Libor (one of the more popular structures in the financial sector) with a negative value indicating a spread in favor of the USD lender. While there was 20-30 basis points of yield pickup available for USD lenders towards the end of last year, this has shrunk to the single digits this year and even reversed to favor USD borrowers a few times for EUR swaps. While it is unlikely that these spreads will structurally flip to favor USD borrowers they may do so on brief occasions in the coming months due to already being so close to parity.

One final place where this continuing shortage of near-cash assets can be observed is in the market for forward rate agreements (FRA). A FRA can be seen as a contract-for-difference on a short term interest rate (in this case USD Libor) that is settled for cash at some future date. This mechanism allows hedgers to lock in a rate by buying a FRA covering some period in the future when they intend to borrow, and receive a payout when the time comes should the benchmark rate rise above the value they locked in. The chart above shows the pricing of a FRA covering the 3 month period starting immediately (green line) and the 3 month period starting 3 months in the future (yelow line). We can see FRA rates have fallen sharply recently as the shortage of available yield in short-term instruments continues.
This is particularly significant since the spread between 3 month FRA and the 3 month overnight indexed swap (white line) is closely watched as a signal of overall financial stability. There is a possibility that this spread could go slightly negative sometime soon as the OIS rate is based the Fed Funds rate, which has levitated around 6-7 basis points while other money market rates have plunged down to zero. The reason for this is the Fed Funds rate’s decreasing volume and overall importance relative to overnight repo rates (shown in blue and red) mean that it does not react much to ongoing money market pressures. So while the FRA rate could briefly go below OIS, this would not represent a major systemic problem if it remains comfortably above overnight repo rates, as would likely be the case in that scenario.
That is all for this week! Thanks for reading this weeks edition if you made this far and hope to see you back again soon for another Chartbook :)
Cheers,
DC
best